
Card sorting has informed a new information architecture for Learn courses
Card sorting has allowed us to better understand how students expect information to be grouped in Learn.
Following on from the top tasks survey, card sorting was the next user research study in our programme building up the elements of a better user experience in Learn.
Top tasks surveys have identified what really matters to students using Learn
Card sorting is a commonly-used technique that helps us understand how users would group items together. We can analyse the groupings students create to inform how content should be structured, helping us devise an information architecture.
Introduction to card sorting from Nielsen Norman Group
What we did
We asked students to group together 47 items in a way that made sense to them. These items were a slightly modified version of the list of top tasks. Each of these was an item of content or piece of functionality you can expect to find in a Learn course.
We ran this as an open sort, so participants did not have pre-defined categories to choose from. This made the analysis trickier than it would have been with a closed or hybrid sort. But at that stage of the project we had very little idea of what students might expect a standardised Learn structure to be, or what terminology they would use. So we wanted to avoid leading participants by providing our own categories and wording.
775 students completed the study. Considering how time-consuming it is to meaningfully complete the card sort, this was a phenomenal response.
Filtering the responses
The key word there is ‘meaningfully’. We did offer an incentive to complete this study. Students were offered the chance to enter a prize draw to win Amazon or Blackwell’s vouchers. So, as with all of these studies, we had to be aware of people completing the surveys with spurious responses just to enter the prize draw.
The software we used for the card sort, Optimal Sort, already detects when people complete the study unusually quickly and filters these out. But it doesn’t catch everything, and I found that I had to work through each of the responses to validate them.
Part of the issue was that, because this was a fully open sort, many participants created categories called things like “very important”, “unimportant”, and “never use”. This wasn’t malicious (and such respondents were kept within the prize draw). And in a sense it was useful to see the sorts of things students were putting into such categories.
But it wasn’t very useful to us in informing us about students’ mental models of what items of content are associated with each other. Besides which, we had already used the top tasks survey to establish what is the most important content to students.
Findings
775 responses each containing individual groupings of 47 items is a lot of data. Combined with the fact that this was an open sort, that made analysing the results challenging.
One striking finding was that each of the 775 responses was unique. No two students submitted the same card sort.
This highlights the great challenge faced by the Learn Foundations project in attempting to create a more standardised template that meets the wide variety of needs across the University. Students talk about consistency, but they don’t agree among themselves about what that consistency would look like.
However, some clear groupings did emerge, and this was a major stepping stone towards the creation of the new Learn Foundations template.
Items about lectures are heavily associated with each other
Despite some of those differences between different students, one thing was overwhelmingly clear: students expect items about lectures to be grouped together.
Strikingly, lecture slides, lecture notes/outlines/handouts, and lecture recordings were grouped together by 91% of respondents. This is exceptionally high.
These are the same three items that came out as the top tasks. These are hygiene factors for students. Not only are these the most important items for students, they also expect to find them in the same place. If your Learn environment is not meeting this basic expectation, students are going to be frustrated.
Other groupings
The next strongest grouping was around items that appeared to be related to help and support. This included items like staff profiles, careers information, and help using Learn.
Another section around assessment emerged strongly. This contained a large number of items, all of which were related in some way to assessments.
Then there was another category that appeared to be focused around course administrative information. This included items like class times, class locations, course handbook, and workload and expectations for the course.
Two visualisations to help analyse card sort data
Optimal Sort contains two visualisations to help you analyse card sort data.
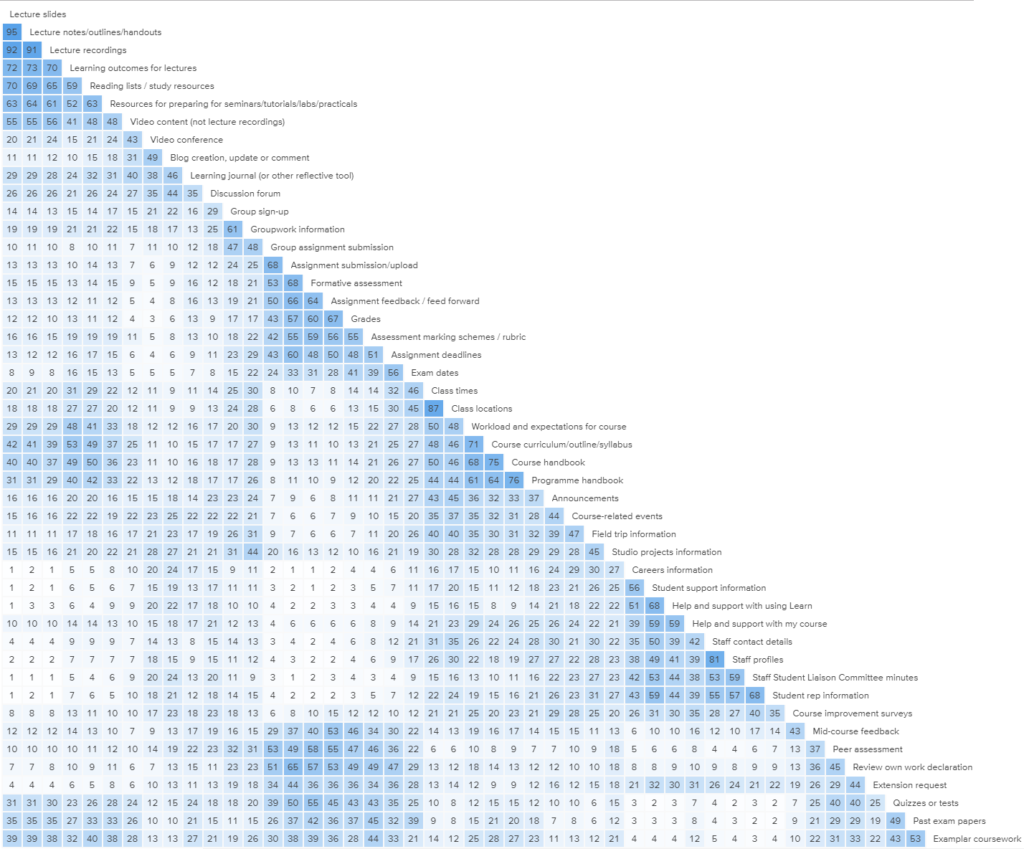
The similarity matrix showing clusters forming out of the card sort, denoted by areas of darker blue
The one I tended to rely on the most is called a similarity matrix. This simply compares each card with every other card, and shows you what percentage of respondents grouped them together. The software clusters common groupings together. So areas with a lot of dark blue are items that have been most strongly associated with each other.
The other visualisation is called a dendogram. This attempts to create groupings of cards, displaying what percentage of participants agree with these broader groupings.
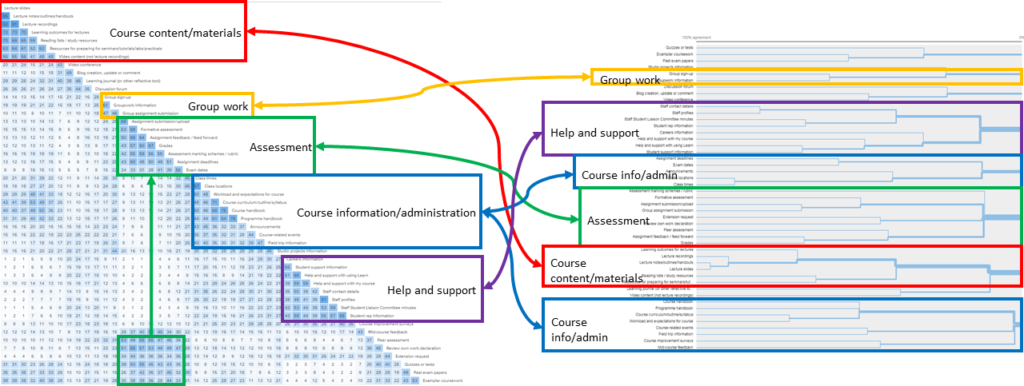
It was promising to see that these two approaches of analysing the card sort data broadly corroborated each other, with similar groupings of categories emerging from both.
Terminology — naming the categories
As well as developing a new template, the Learn Foundations project wanted to standardise the terminology used across different Learn courses. This was another reason to run an open sort. By asking students to create the category names themselves, we got an insight into what students would expect navigation menu items to be called.
The most common category names given to cards were:
- Assessment — assigned to 1,424 cards
- Course information — 1,348
- Course content — 644
- Information — 486
- Assignments — 471
The most common words used across all categories were:
- Course(s) — used 6,962 times
- Info(rmation) — 6,195
- Assessment(s) — 2,697
- Support — 1,818
- Resources — 1,795
This data gave us a pretty good steer on some terminology decisions. For instance, we could clearly see that more people were using ‘assessment’ rather than ‘assignment’ to describe certain types of content.
However, a lot of the labels students provided were far too generic to be meaningful. (This isn’t a surprise, because most students aren’t information architecture experts!) For instance, we can’t attach any meaning to the fact that 486 cards were assigned to a category called Information, because every item of content is information of some kind.
Course information conundrum
This brings us on to one of our biggest conundrums at this stage. The Course information category that emerged through the card sort caused us some head-scratching. While it seemed obvious what students were getting at by grouping these items together under this heading, course information just seemed too generic to work as a label.
Everything in Learn is course information of some sort. So why would it be helpful to create a section with this name?
As if to underline this problem, I found that every single card was added a minimum of five times to a category called ‘Course information’. So it seemed like a big risk to include a section in our information architecture that could contain anything.
Yet, we struggled to find an alternative name for the grouping of cards that students had created through the card sort.
Solving this problem was one of the focuses of the next stages of our research — to be covered on this blog shortly.
See the data
If you’re a staff member, you can view some of the card sort data in more detail on the Learn Foundations wiki:
Learn Foundations user research wiki page
Find out more
This card sort study is just one strand of a programme of user research the User Experience Service has conducted as part of the Learn Foundations project.
3 replies to “Card sorting has informed a new information architecture for Learn courses”