
The top task survey method – what it is and why we use it
In June 2018, the University of Edinburgh ran a top tasks survey to identify what information prospective students are prioritising when thinking about applying to university. In this post, I’ll talk about the method, why we ran the original survey, the insight we gained from it, and why it’s time to do it again.
The top task survey method
Users of digital services typically want to complete a small number of tasks that are more important than others. Identifying what these tasks are, according to Gerry McGovern, the digital strategist who developed the top task method, can help us reduce unnecessary complexity by prioritising what really matters to users.
The method requires following a few simple steps:
Step 1: Develop a list of tasks to present to users in the form of a survey (often quite a long list of 60 or more)
Step 2: Ask users of the service to vote on the top 5 most important tasks from a randomised list
Step 3: Analyse the results to identify the top tasks users are trying to complete
Read Gerry McGovern’s article for a more detailed look at the top task method
Analysing the results from the survey allows us to visualise the small number of tasks that are most important to users – what McGovern calls the long neck.
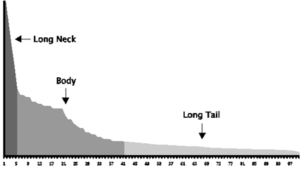
A top task graph by Gerry McGovern, showing the small number of tasks forming a ‘long neck’.
Read Neil Allison’s blog on getting to know your organisations long neck
The 2018 top task survey
In June 2018, the University of Edinburgh approached User Vision, a UX consultancy firm based in Edinburgh, to help design and run a top task survey. The goal of the survey was to help improve the online recruitment and admissions experience by ensuring that digital content met the needs of prospective students.
To meet this goal, the University first had to identify what tasks prospective students most frequently want to complete.
With 65 tasks identified and randomised, the survey asked prospective students to:
“Select up to 5 topics from the list below that are MOST IMPORTANT to you when choosing (or helping someone choose) a university”
The survey ran from 1st June – 18th June and was completed mostly by prospective students across different demographics and study levels.
Demographics
In total, there were 3792 responses to the survey, representing a cross section of people interested in the information we provide for prospective students.
Responses by geographical location
- Scotland: 13%
- England/Wales/Northern Ireland: 20%
- Europe: 21%
- Rest of the world: 46%
Responses by study level
- Prospective undergraduate students: 53%
- Prospective postgraduate taught students: 25%
- Prospective postgraduate research students: 13%
- Prospective online students: 5%
- Parent/Carer/Guardian: 3%
- Other: 1%
Breakdown of top tasks survey results
The results from the survey show us the small number of tasks (the long neck) that are most important to prospective students across different study levels and geographic locations.
We can see an example of this by looking at the list of top tasks for the combined demographics:
- Entry requirements: 8.5%
- Tuition fees/costs: 5.9%
- University rankings: 4.9%
- Financial support and funding opportunities (scholarships, bursaries and loans): 3.2%
- Cost of living (housing/accommodation, food, transport): 4.4%
The survey provides a detailed breakdown of top tasks for each demographic.
For those of you who don’t have time to read the full report, it’s worth noting some similarities and differences across the demographics.
Entry requirements and tuition fees/costs are the two most important tasks to all demographics but there are some nuances in emphasis of what is important when each one is considered seperately.
UG: more emphasis on information about accommodation
PGT: more emphasis on information about financial support such as scholarships and bursaries
PGR: more emphasis on information about financial support such as scholarships and bursaries and finding a supervisor
Online: more emphasis on information about how long a programme takes to study
Reflections on the 2018 top task survey
While the information gained from running a top task survey is important in helping us understand the needs of our users, there are things that we can improve for 2025 that the 2018 survey didn’t get quite right:
- ran only once at a particular point in the year which didn’t capture enough demographic information (we know prospective students have different priorities at different points in the academic cycle)
- list of items was provided by the University and in some cases didn’t represent a task clearly
- tasks were not all presented at the same level of granularity
- inconsistent language – sometimes “course”, sometimes “degree”
Despite my criticism of the execution of the 2018 survey, it has nonetheless provided the biggest sample source of insight for our team (apart from website analytics) and has been well used. The findings of the survey have been a valuable starting point, informing user research activities for our team.
By understanding the tasks prospective students most frequently want to complete based on different demographics it provides focus for what areas of research we conduct and what content we improve.
We’ve also been using the insight to corroborate other research findings to give us confidence in our evolving understanding of the prospective student experience, which has helped us develop the new University study site.
The 2025 top task survey
While the top task survey is a useful method, its effectiveness is dependent on how easily users understand the tasks they are being asked to choose between.
Insight from prior user research and collaboration with colleagues across Communications and Marketing and Student Recruitment and Admissions has ensured that we are presenting the right tasks with the right level of clarity and granularity in the new survey.
The top task survey for 2025 has just launched and is already collecting responses.
The survey will run until the end of August, and we will continue to run it at different points in the academic cycle to capture the different priorities we know prospective students have.
Next steps
After the first run of the survey is completed I’ll follow up with another post to share a summary of what we learned.