
How students interacted with our teaching and learning in 2021-22 content when we added school-specific guidance
After adding links to school-specific guidance in our content around teaching and learning in 2021-22, we found that prospective students only interacted with content from a handful of schools.
What we did
Towards the beginning of 2021, Andy wrote about an approach we took to try and help mitigate growing enquiries from students about how they would be taught in the new academic year:
Developing content about teaching in 2021-22: the start of a process, not the end
The team developed two central website pages: one for undergraduates and one for postgraduates.
In March 2021, Andy reviewed Google Analytics and click data for these pages to see how students had been interacting with them.
Learning from how students are interacting with our content about teaching and learning in 2021-22
Based on the data from March, which indicated that there we an appetite for more detailed information on how degrees will work in 2021-22, we adapted the pages to include school-specific guidance on teaching, learning and supervision/support.
Since then, I’ve reviewed more recent data to understand if student behaviour changed once we added links to school-based guidance in the content.
What we found in our June data
More students found and used this content
Over the month of June, Google Analytics logged 6,242 unique pageviews (roughly 2:3 split between the undergraduate page and postgraduate page). This value is roughly a third greater than recorded in March.
The most common routes to people reaching these pages were:
- from our Undergraduate or Postgraduate study home pages
- from the prospective student page of the Covid-19 news site
- from the Business School’s 2021-22 Postgraduate Learning and Teaching page
- from the hybrid-learning page on the New students site
Although the most common routes taken to reach our content had not changed, more people were accessing our content as we got closer to the new academic year starting.
But what happened when they were on the pages? Did user behaviour remain similar to earlier in the year? Did students interact with the new schools content?
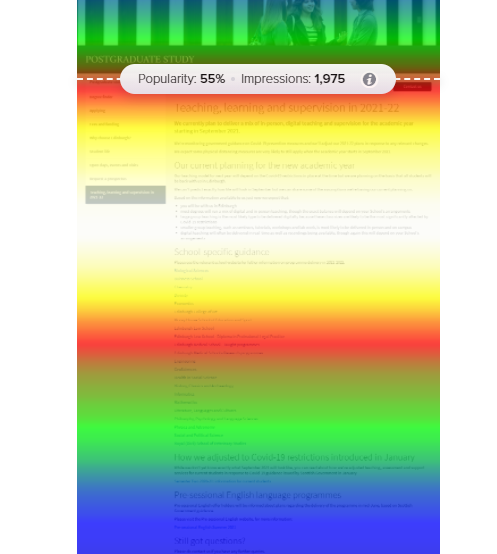
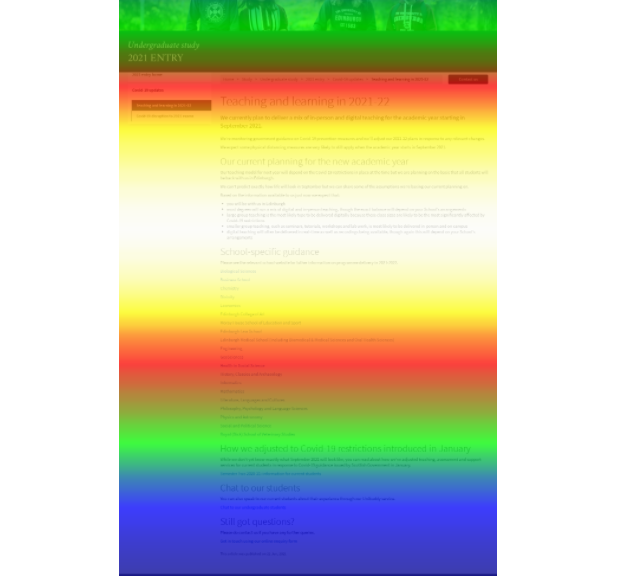
The most viewed information was the generic teaching and learning guidance at the top
These scroll maps show the sections of our undergraduate and postgraduate pages that were most viewed. The brightest sections have been viewed the most number of times and the darker sections have been viewed the least.
Undergraduate Page
Postgraduate page
For both the undergraduate page and postgraduate page, the top section of ‘Our current planning for the new academic year’ was the most viewed area of the page.
This was similar to the March data where info on how we were currently delivering degrees in 2020-21 was both the topmost and most viewed area of the page.
Compared with March, there were relatively fewer views of the contact calls to action (‘Chat to our students’, ‘Still got questions?’) at the bottom of the page. This is likely reflective of how much further down they were with the school-based links inserted.
The value of school-specific guidance varied
While the generic guidance was view the most, the views quickly dissipated further down the page where we placed the school-based guidance.
The click maps for the undergraduate and postgraduate pages show large variations in activity between the school-specific guidance:
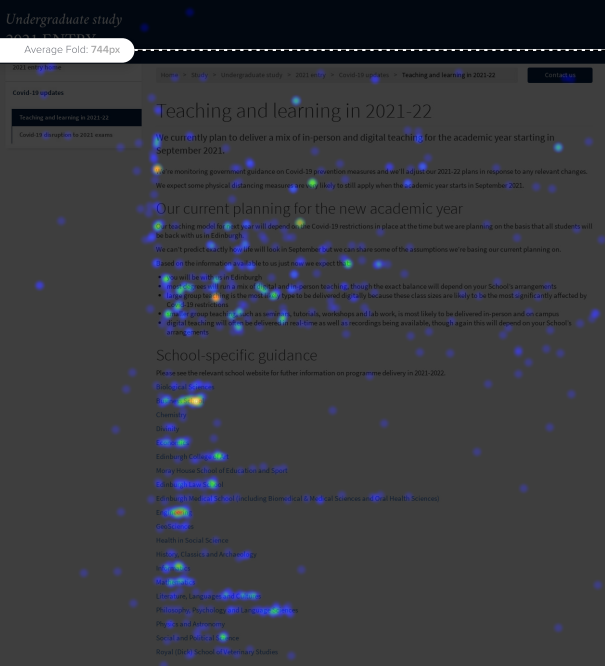
Undergraduate Page
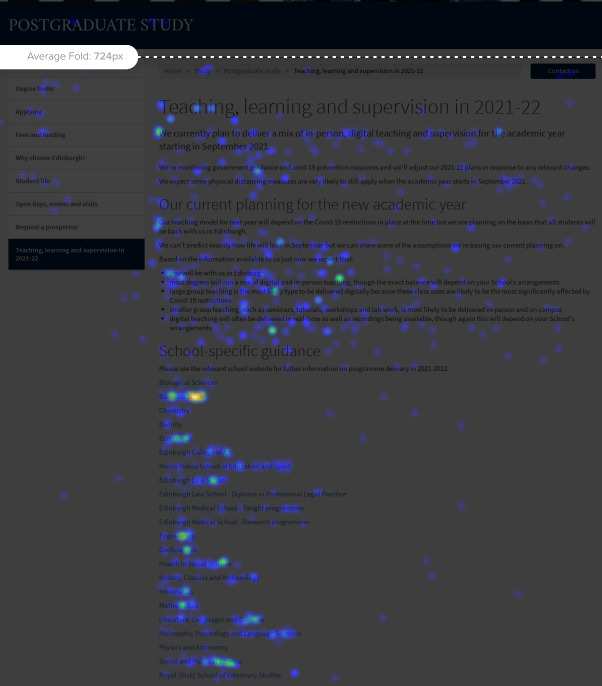
Postgraduate page
For the undergraduate page, the clicks were mostly concentrated on the Business School and Engineering school-specific guidance. Similarly, for the postgraduate page, the clicks were heavily concentrated on the Business School.
All school-specific guidance had traction, but this fluctuated in intensity between the schools, and only a few received more traction than the majority of others.
Conclusions
Although we cannot claim for certain why we’re seeing these results, the data do raise some interesting questions we could explore further:
- Are only prospective students from certain schools interested in teaching information at school-level, and why?
- Are students accessing teaching and learning content directly from their schools instead?
- We know students do not necessarily associated themselves with a school (or even understand them!) before they arrive, so is this why we are seeing more concentration on generic guidance?
While we do not know if we will need to provide teaching and learning content for the next academic year, these results have shown what gets looked at versus not, and can provide a good baseline for content we may provide in future.