
Learning from how students are interacting with our content about teaching and learning in 2021-22
Content on what teaching will look like in September is limited by the difficulty of predicting what restrictions will be in place. But there’s evidence that saying what we can is already delivering value to students and the University.
What we did
I recently wrote about the approach we’re taking to try and help mitigate growing, and understandable, enquiries from students about whether they’ll be taught online, in person, or a mix of both in the new academic year.
Developing content about teaching in 2021-22: the start of a process, not the end
I’ve been reviewing Google Analytics and click data for these pages to see how students have been interacting with them.
What we’ve found (so far)
Students are finding and using this content
In the first four weeks, Google Analytics logged 4,591 unique page views (pretty much a 50/50 split between the undergraduate page and the postgraduate page).
The most common routes to people reaching these pages were:
- from our Undergraduate or Postgraduate Study home pages
- from the prospective student page of the Covid-19 news site
- directly, for example after searching on Google
People are finding our content. This is good news. But what happens when they are on the pages?
The most important information is the most viewed
In structuring these pages, I tried to get to the point quickly and put the most important information first.
That’s because when we read on the web, we scan for information that will help us complete our goal.
We also often don’t hang around for long to find it.
According to the Nielsen Norman Group, on the average web page, users have time to read at most 28% of the words.
Nielsen Norman Group: How little do users read?
This scroll map shows the sections of our postgraduate page that were most viewed. The brightest sections have been viewed the most number of times and the darker sections have been viewed the least.
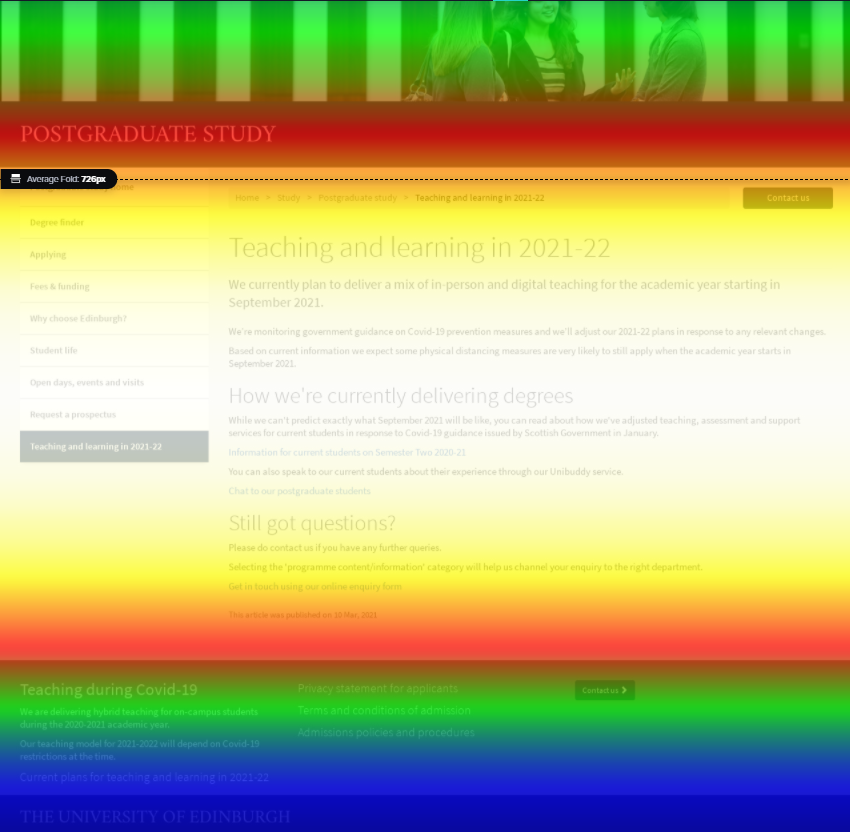
The information we prioritised is in the brightest sections of the scroll map.
Our page has about 200 words. Nielsen assumes a reading speed of 200 words per minute (WPM).
Based on the average time people spent on the two pages, most will have read about 60% of the content before leaving or clicking.
The scroll map suggests there’s a good chance that this 60 per cent will include the content we’ve prioritised.
It’s also worth noting that there are relatively few views of the footer in the bottom left of the screen. Before we published these dedicated pages on teaching and learning, we relied on this footer as one of the main sources of information on this topic.
There’s an appetite for more detailed information on teaching, learning and support
Both pages include the same three calls to action users can click on:
- information for current students on teaching and learning in Semester Two 2020-21
- chat to our current students through Unibuddy
- contact us via our online enquiry form
This heatmap shows that the information for current students call to action is by far the most used:
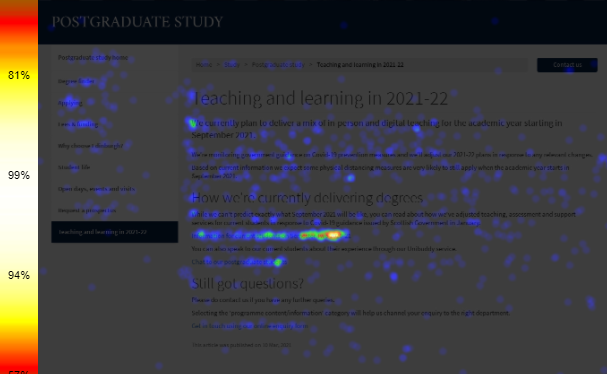
The heatmap shows most clicks are on the term ‘Semester Two 2020-21’
The clicks are mostly concentrated on the phrase ‘Semester Two 2020-21’.
Based on this we’re going to shift that term to the start of the link text so that people find it faster.
We included this call to action because showing how degrees are currently delivered is the best detailed information we can offer until 2021-22 teaching plans are finalised.
The response indicates that there is an appetite for more detailed information on how degrees will work next year (a similar pattern is seen on the undergraduate page).
The content is helping us to answer student enquiries
Delivering content that’s useful to students gives us the best chance of helping our enquiry teams.
I’ve been in touch with colleagues in our Enquiry Management Team about the teaching and learning pages’ impact on their work.
The early feedback is promising:
- the pages are now used in Enquiry Management responses to queries about teaching next year
- staff can now direct people to specific information about teaching and learning rather than using the general Covid-19 page or passing enquiries on to schools
- in a sample of 50 enquiries where users were directed to the teaching and learning pages there were four follow-up queries
- two of the follow-up enquiries were thank you messages from people who found the page helpful, the others asked for detailed degree level information about teaching (something that only schools can answer)
It’s early days and we’ll keep monitoring feedback on enquiries. But it’s good to know the content is already adding value to the University by helping us respond to student needs and questions.
What next
We expect demand for information about teaching and learning plans will increase as the new academic year gets closer.
We’re working on a revision of these pages based on what we’ve learned so far.
We can make some changes now. For example, front loading our link text with the keywords most users are clicking.
Others, such as trying to better meet the appetite for more detailed content, will depend if/when more detailed information we can use is available.
The difficulty of predicting what restrictions might look like in September isn’t going away. But providing the information that we can, when we can, is paying off and giving us insights on how to improve.


1 replies to “Learning from how students are interacting with our content about teaching and learning in 2021-22”