Getting insights from qualitative enquiry data
How can we get insights from unstructured enquiry data? In this post I talk about one approach to this question using the Student Immigration Service as a case study.
Background
In January 2022 we started a user experience and content enhancement project for users of the Student Immigration Service (SIS). The SIS team helps international students with immigration matters.
Our goals are to:
- improve the digital experience of users
- reduce unnecessary enquiries by encouraging self-service
The SIS team have two enquiry channels: webforms and direct emails. In 2021 the SIS team received close to thirty thousand enquiries – 92% of these were direct emails, the rest were webform submissions.
I hope you will agree with me that reading over twenty-seven thousand emails is not a great way to gain insight, or at least not an effective one. So, how can we get actionable insights from large amounts of unstructured data?
Webform enquiries
Webform submissions data is semi-structured and easy to handle. Any information needed for analysis can be added as a restricted format field on the webform (e.g., multiple choice, radio button, check box, etc.). Using restricted fields we can know, for example:
- the main topic of an enquiry
- user or audience types
- level of study, etc.
It is important to address these needs at the design stage but, once we have data categorisation, calculating metrics and indicators is a simple task.
Email enquiries
Direct email enquiries are a different story. The first hurdle is that, unless you manually tag or set up keyword tags for your emails, there is no automated categorisation. Additionally, there is no guarantee that the enquirer will have included all the information needed for resolution and/or analysis of the enquiry.
This was the case for the SIS inbox, so I had to come up with a way in which we could quantify the data and, where possible, divide it into categories.
To do this, I had to:
- export the data into a suitable format
- clean and transform the data
- analyse the resulting data to inform our project goals
Data acquisition
The first step was to extract and export the data into a suitable format. This involved exporting data from Outlook into Excel via a Macro (it was nice to brush up on my VB skills). In this instance I only extracted emails for analysis, and excluded to-do and calendar items.
Data cleaning
Cleaning your data is essential not only to improve the efficiency of your analysis but also to ensure you are complying with data protection regulations in case it ever gets published. For this dataset I removed:
- undeliverable emails and automatic replies
- all instances of university usernames (UUNs) from the subject line
- all URLs from the subject line
Data transformation
Data transformation is the process of changing data from one format or structure to another. Some examples of this can be aggregation of datasets, data manipulation, attribute creation, etc. For this project, I used these methods to determine:
- the sender type based on the email protocol (i.e., student, staff, external)
- the number of emails per enquiry
- the duration of enquiries
Additionally, I used natural language processing (NLP) to find the most common enquiry topics.
Natural language processing
Natural language processing (NLP) is the application of computational techniques to the analysis and synthesis of human language and speech.
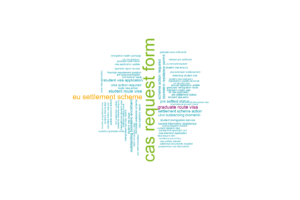
Using an NLP tool, I extracted the most common two and three-word phrases (n-grams) from email subject lines. We used these as a starting point to:
- define enquiry categories
- help decide the areas of focus for the enhancement project
One way to visualise these results is as word clouds like the one shown below (Figure 1).

Figure 1. Word cloud showing trigrams extracted from SIS enquiry email subject lines
Insights
After data transformation and manipulation, we were able to gain insights into:
- monthly, daily, and hourly enquiry volume trends
- the main topics of enquiries based on subject lines. These can be used to inform areas where content enhancements can have the most impact.
- the type of users making enquiries
- the average resolution time, which helps us identify enquiries which might be self-served with content enhancements
Conclusions
This was my first foray into NLP. It was a great learning opportunity and gave us great insight into the enquiry trends for this project. But, it can be used more effectively to analyse free text where categorisation already exists. As an example, we can do the same sort of analysis on webform submissions from undergraduate students or EU nationals to better understand those audiences.
This work emphasised how having (semi)structured enquiry data, where possible, translates into a better use of resources where data analysis can be used to drive continuous improvement. And, it means that specialist input is not necessary to gain those insights on a day-to-day basis.
To learn more about the project with the SIS team:
To read more about how I decide on which tools to use for data analysis:
If you have any questions, please get in touch


