
Appraising the new undergraduate study website: a scorecard approach
We recently reviewed the new undergraduate study website with 19 students, using a summative usability testing approach to produce a performance scorecard. While the new site scored really well, we identified a few areas to improve further.
Why do we want to measure performance?
It’s been great to get such positive feedback from around the University in response to the new UG study provision but how do we know if it’s performing well enough for our prospective students?
To answer this question, we wanted to appraise the performance of the website for the most important tasks we know undergraduate prospective students need to complete.
We used a scorecard approach to summarise our findings derived from Lou Rosenfeld’s article: Stop Redesigning and Start Tuning Your Site Instead
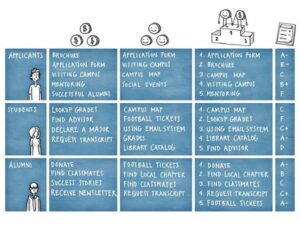
The example taken from Lou Rosenfeld’s article shows for each audience there are tasks that important to both the business (column 2) and the user (column 3). Through a process of negotiation between the two an amalgamated list of tasks (column 4) is produced. This is graded on the basis of how successful the target audience are in completing those tasks (column 5).
The list of tasks is short because research has shown that a small number are disproportionately important. We have a limited capacity for ongoing appraisal so it’s important that we focus on the things most people want to do most of the time.
Identifying top tasks
Prior research the team has conducted over the years provides us with robust insight into what tasks are most important to prospective students.
2018 Top Task survey: Quantitative insight from this survey helps us understand what the small number of tasks are that are most important to a range of prospective student audiences.
1-1 student interviews: Qualitative insight from asking students about their experience of applying to university helps us validate what we learned from the Top Task survey.
Card sorting exercises: When we asked students to categorise website content, it helped us develop the information architecture of the new site, as well as giving us further insight into how they prioritise the information that is most important to them when applying to university.
Working with Head of Undergraduate Recruitment Claire Forsman gave us a perspective on the University’s business goals in this area.
Measuring performance
Unlike most usability testing we do which highlights the most significant issues we need to fix, this time we needed an approach that would give us measures of success or failure. We wanted quantitative outputs.
In usability specialists’ terms, we needed to do summative testing rather than formative testing.
- Formative usability testing is what the team does on regular basis, giving us qualitative insight to inform ongoing improvements.
- Summative testing was a new approach for us. It’s done at the end of the development process, once the product is nearly or completely finished, to assess if it meets the usability standards set for it.
Summative usability testing is more complex and time consuming to do. It requires the recruitment of a lot more participants. We were aiming for 20 prospective students, rather than the usual 5 or 6. We needed to generate more statistically significant data because our focus was on measuring the performance of students completing priority tasks.
Formative vs. Summative Evaluations: An article by Alita Kendrick for Nielsen Norman Group
Establishing measurements to calculate our usability metrics
To establish metrics, we can track over time and demonstrate ongoing improvement in the website’s performance, we needed some standardised measurements.
In our study we measured:
- Success rate: Did the student achieve success in a task, based on performing a specific action or providing a definitive answer to a question?
- Average Time to complete task: The time it took for the student to reach an identified point of success.
- Error rate: The number of times the student deviated from the direct route to complete the task; the number of wrong turns they took on their journey through the website.
- Single Ease Question (SEQ): A measurement of the student’s perception of ease to complete task on a scale on 1 -7 (1 being very difficult and 7 being very easy).
Most of our measures were based on things the student did in the course of completing the tasks we set. But we wanted to also learn how they felt about the experience, which is why we asked the “Single Ease Question” at the end of each task.
The question was: Overall, how difficult or easy was that, from 1 (very difficult) to 7 (very easy)?
How to use the Single Ease Question: An article by Emilia Korczynska for Userpilot
Participant Recruitment
We aimed to recruit 20 participants, but ended up with 19 due to a number of recruitment challenges associated with the time of year we were conducting the study. During April and May, many of our target audience were revising for their exams. So, we had to compromise a little and make the shortfall of real prospective students up with some current undergraduate students who could remember the process of applying to university from the previous year.
We recruited:
- 7 prospective undergraduate students, all Scottish high school pupils (S5/6)
- 12 current undergraduate students at the University of Edinburgh
- 1 international
- 4 Scottish
- 7 from the rest of the UK (RUK)
Our scorecard
We produced a scorecard with each task graded according to measured performance.
| User needs and business goals amalgamated | Grade |
|---|---|
| Degrees available (Does Edinburgh offer something I want to do?) | B+ |
| Entry requirements (How likely am I to be offered a place?) | B |
| Fees and total cost of study (How much will it cost?) | C |
| Degree content (What will I study as part of the degree?) | A |
| Application process (What happens when and how?) | A |
| Visit (How and when can I visit the campus?) | B |
| Careers (What might I do after graduating?) | A |
Grading is of course subjective, but we needed a system that would allow us to give a grade to each task. The success rate metric was the primary factor in our grading system. It was our starting point for allocating a grade:
- A: 90+% of students successfully completed the task
- B: 75-90% of students successfully completed the task
- C: 60-74% of students successfully completed the task
Once we had the initial grade, we then looked at our other measurements and considered whether we needed to down grade:
- If time on task was more than double our expected time to completion
- If the path to success contained notable levels of error rate
- If the average Single Ease Question score was lower than 5
Why we didn’t score all A grades
You might think that with a new system and website, with extensive user research and usability conducted that it should have delivered a straight A scorecard.
I think the results show that there’s always room for enhancements, and the team as a whole are fully committed to continuous improvement. Appraising and sharing our findings is an important part of that.
Where we might do better
Degrees available (Does Edinburgh offer something I want to do?) = B+
- Only 2 of 19 students deviated from the direct route to see a list of degrees they might be interested in. While all students ultimately found the degrees they were interested in, an 89.5% success rate fell just below our criteria for an A.
Entry requirements (How likely am I to be offered a place?) = B
- Most students didn’t understand why they were being asked to prove their English language capability as native English speakers so did not see this as something they would need to meet. The single international student did understand the importance of this and confirmed what he would need to provide to apply.
- We originally graded this task as a C when we presented our findings in May. However, since then we’ve received data from our Admissions Team in Student Recruitment and Admissions which shows that we don’t typically receive applications from UK applicants who don’t meet the English language requirements. While the students in the study did not understand why they needed to meet this requirement, we know it isn’t an ongoing issue for colleagues in admissions.
- All the RUK students who were applying with A-level qualifications failed to understand why grades were presented to them in a range from high to low (e.g. AAA-ABB). They assumed that they could make a competitive application by meeting the lower end of the range. This is a known and ongoing challenge for the University (and indeed other universities).
- We need to look at new ways to communicate the levels of competition for places at Edinburgh, so that prospective students make application decisions that maximise their chances of receiving an offer.
Fees and total cost of study (How much will it cost each year?) = C
- All students could identify the cost of fees each year but struggled to understand what the living costs would be. Most viewed only the living cost information on the programme page, but fewer clicked through to a subsequent page that provided a more detailed breakdown.
- All students who viewed the page that displays a breakdown of likely living costs found the information confusing. No students were able to accurately estimate the living costs and add that amount to the fees to produce a realistic total for a year of study. Most students said the amounts were too wide to make this calculation.
We need to look at:
- How students are interacting with cost of living information using website analytics, so we can gauge whether the behaviours we saw are being repeated at scale.
- Potentially trying new ways of promoting the information about estimating a likely cost of living, so that more students investigate it from degree profile pages.
- Co-designing the cost of living information with students so that we can present the information in a way that is more accessible and comprehensible to them.
Visiting (How and when can I visit the campus) = B
- Most students easily identified that they could attend an open day and when the next one was. However, four students (21%) failed to do this because they instead identified information about an offer holder event and assumed that the was the next opportunity that they had to visit the campus. These events are not open to all prospective students.
- We will look at how we communicate the requirements for students booking on to offer holder events and provide a link from this content to open days and campus visits to get students who’ve taken this wrong turn back on track.
Building on what we learned in this study
Our report card shows us the biggest problems we have uncovered, and our aim is to repeat the process, reporting back at least annually. We want to be able to demonstrate improvements in the prospective student online experience in every cycle.
Addressing the issues
Some of these issues are relatively quick fixes, and we’ve put changes in place already that we believe will alleviate some of the issues we saw.
But some issues are more complex and go beyond simply tweaking content and navigation. These issues will need to go into our backlog for prioritisation later in the year. Right now, our content design teams are currently working towards the launch of the newly design provision for prospective postgraduates and this has to be our priority.
Making future appraisals easier
This kind of study is resource intensive and isn’t something we can complete frequently.
I learned a lot about planning, executing and reporting a summative usability study this time which will make future studies more efficient in the future.
We also need to find ways to make effective use of web analytics and corporate data to help measure performance on an ongoing basis. This is where Carla, our Performance Analyst, will be able help once she returns from secondment later in July.
Next steps
The next priority for a summative testing appraisal and scorecard will be the prospective postgraduates website which we will launch in October. Again, we will recruit prospective students to take part in our review summary and share a scorecard and findings to build on into 2026.
We would also like to run similar studies with important sub-groups such as international students and undergraduate widening access applicants as they have different needs and expectations which we need to work harder to serve. I hope that through collaboration with Carla we can reduce the overhead involved and make this more feasible among our other user research priorities.
Read more
We regularly share blog posts about our usability testing activities.
More posts about usability testing done by the Team