
Redesigning our living costs content for prospective students
We spent most of March redeveloping our living costs pages. Using insights from discovery work and working with subject matter experts, we calculated new figures, rewrote the guidance and tested it with current students.
Project background
This work is part of a project we’re doing to help prospective students better understand the cost of study. One driver for this project came from usability testing we did last year, where we saw participants struggle to understand our existing living costs content.
Learn more about the cost of study project background and discovery phase
Blog recap on usability testing the postgraduate degree finder
Living costs development activities
Auditing our existing living costs content
We started with an audit of our existing living costs pages on the Undergraduate and Postgraduate study sites.
We knew from the previous usability testing that people struggled with two main aspects of the existing pages:
- costs presented in a range rather than as a single figure (participants found the ranges too broad and therefore ultimately unhelpful)
- costs presented as monthly rather than annual (many people mistook the monthly figures for annual ones)
Looking closer at the pages, we discovered further issues, including:
- a lack of sources and explanations for how figures were calculated, and whether they were estimates or exact
- little explanation of the difference between accommodation types, and no differentiation between the two types of private accommodation (renting from a landlord versus purpose-built student accommodation)
- figures that seemed unusually high for certain costs, for example £40 for a monthly mobile phone contract
We also returned to our findings from the discovery phase of the project and voted for our favourite features on other universities’ living cost pages to consider incorporating in our content.
Designing the new pages
When thinking about the design of these pages, we started with the structure: what was the most user-friendly way to present these costs?
The existing pages separated living costs by accommodation type:
- University catered (undergraduate page only)
- University self-catered
- Private student accommodation
Each had its own table listing the rent for the accommodation as well as all other living costs, with a final total organised by month and year.
In addition to being table-heavy, this approach did not allow for quick comparison between the different accommodation types. It also did not leave much room for non-accommodation costs, such as food or utilities, and the reasoning behind how those costs were calculated.
To address these issues, we opted for a structure where each individual living cost would have its own section, with the average monthly cost listed as one figure in the heading and the sources listed underneath in an accordion.
We also designed an ‘Estimated total living costs’ table that would add up all the monthly figures and provide corresponding annual figures (a 39-week year for undergraduates and a 52-week year for postgraduates). This would leave us with one final figure for the average monthly and annual cost, which could be stated in the page summary.
In addition to this content, we added:
- a section on one-off living costs such as bedding, towels and utensils
- a section on other costs to consider, such as tuition fees
- cards linking out to University advice around budgeting and finding part-time work
- guidance about seeking financial support for living costs
Solving the accommodation problem
Our existing pages did a good job of explaining University accommodation options but were lacking guidance about private accommodation. With the new pages, we chose to categorise accommodation into four types:
- University catered (undergraduate page only)
- University self-catered
- Private (housing rented by private landlords)
- Private student (purpose-built student accommodation)
To improve the user experience, we:
- set out the information in a table
- included more guidance about the different types of accommodation, including explaining lease lengths
- expressed final totals as one average figure, but indicated the cheapest and most expensive rents for University and private student accommodation
- included utilities, WiFi and laundry in these tables and the final totals
The new presentation offers more clarity on how the four types differ and allows for ‘at a glance’ comparison on prices.
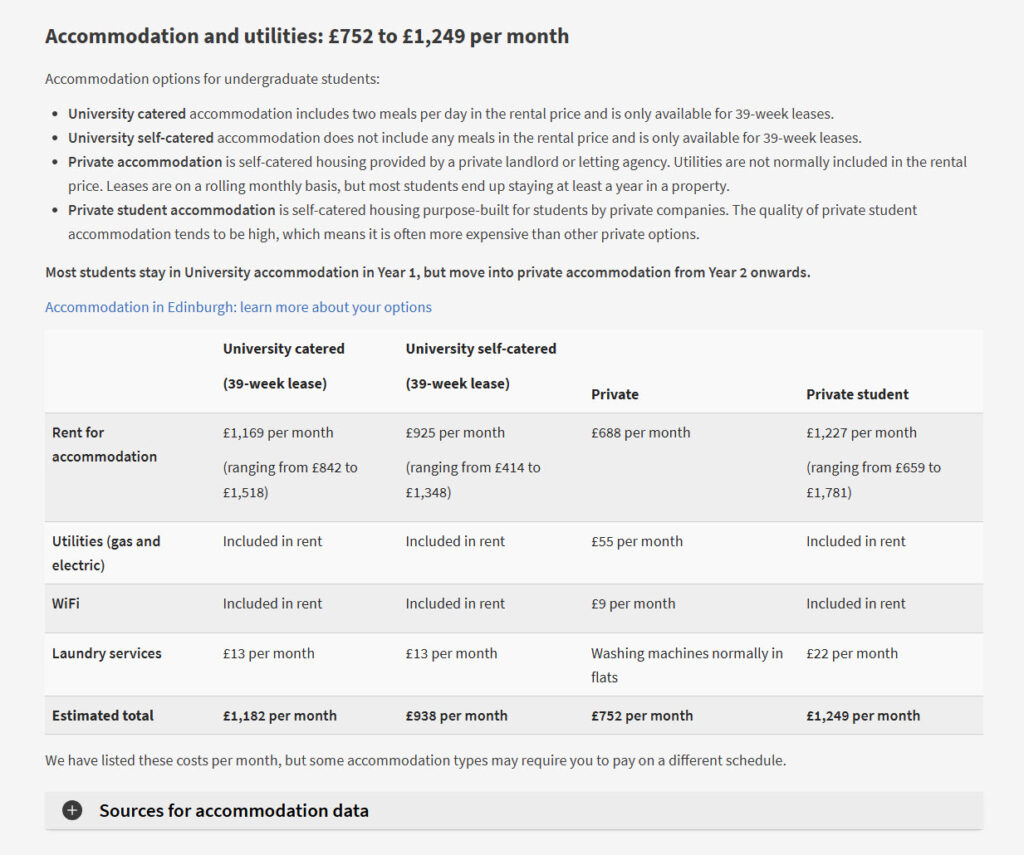
The ‘Accommodation and utilities’ table from the new undergraduate page.
Sourcing data and calculating costs
As we began writing the content for the pages, it was necessary to calculate new figures for each type of cost:
- accommodation
- utilities (gas and electric)
- WiFi
- laundry
- food and other shopping
- mobile phone contract
- socialising, leisure and wellbeing
- local bus travel
We had already discussed where to source the data to calculate these costs, based on what we had learned during discovery. Some, such as utilities, were fairly easy to calculate; others were more complex and time-consuming, most notably accommodation and socialising, leisure and wellbeing.
Accommodation
For University accommodation, we calculated monthly averages based on the catered and self-catered types listed on the University’s Accommodation website. During this process we made a note of the cheapest and most expensive options, allowing us to present an indicative range in addition to a single monthly average.
For private accommodation, we used the Citylets Datahub which shows average monthly rental prices for cities in Scotland, by quarter. To calculate a monthly estimate, we took the average of the quarterly figures for a 4-bedroom property from 2025, then divided this by four.
Citylets Datahub showing average rental prices in Scotland
For private student accommodation, we selected three student accommodation providers and took averages of their room types, once again making a note of the cheapest and most expensive options.
Socialising, leisure and wellbeing
The most complex and time-consuming cost to calculate was, unsurprisingly, the most subjective: socialising, leisure and wellbeing. To arrive at a figure that we felt would represent spending for the average Edinburgh student, we compiled monthly figures for the following:
- a University gym membership
- a Netflix subscription
- a Cineworld student ticket
- membership to a EUSA society
- one meal at an inexpensive restaurant per week
- three pints per week
While not all of these costs would be relevant for all students, we hoped that the overall cost would be representative; one student may spend less on sport and exercise, but more on socialising, which would balance out the costs.
Testing with students and updating the content
With the content written and costs calculated, we built prototype pages and went onto campus to test with students.
We showed nine participants either the undergraduate or postgraduate prototype and asked them to imagine they were an applicant who had come to this page to research living costs. We asked:
- how much their living expenses would be
- which types of expenses were covered by that figure
- what kind of help is offered by the University for living costs
We followed up this task by asking participants how realistic they found the costs presented and whether they had any other feedback.
The tests were largely successful: eight out of nine participants successfully identified the average annual living costs figure, and six out of nine were able to describe the different costs represented. However, in the follow-up questions it was clear that there were some issues, including:
- too much content on the page
- certain figures seeming low, including private accommodation and socialising, leisure and wellbeing
- a lack of clarity on whether costs included tuition fees
On the basis of this feedback, we made some significant changes, including the following:
- Page summary:
- We added a sentence explaining that tuition fees were not included in living costs figures.
- Accommodation and utilities:
- We removed a large chunk of information about private accommodation and moved this to our Accommodation pages on the Undergraduate and Postgraduate study sites instead.
- We recalculated costs for private rent and utilities, taking averages for 2, 3 and 4-bedroom properties (rather than just 4-bedroom) and then taking an average of these figures to come to one figure.
- Socialising, leisure and wellbeing:
- We increased this figure by adding two cappuccinos per week, monthly intramural sport membership and an additional £20 for miscellaneous spending.
- Local bus travel:
- For the undergraduate page, we added (22+) to the totals table and a bullet point underneath explaining that under-22s can travel free on the bus with a Young Scot card.
Updating the page styling
Following the testing, we also made changes to the styling of the prototype pages.
Due to limitations of the CMS, we had been unable to alter the styling of two key features:
- the ‘Estimated totals’ and ‘Accommodation and utilities’ tables – we could not add shading or bolding to make the numbers easier to read
- the accordions containing the source data and calculations – these had the wrong heading level and the default primary styling (red for undergraduate, blue for postgraduate), making them stand out too much on the page
Luckily, our Technical Lead Aaron was able to customise these default styling settings in the backend, enhancing accessibility and allowing for a much clearer presentation on the page.
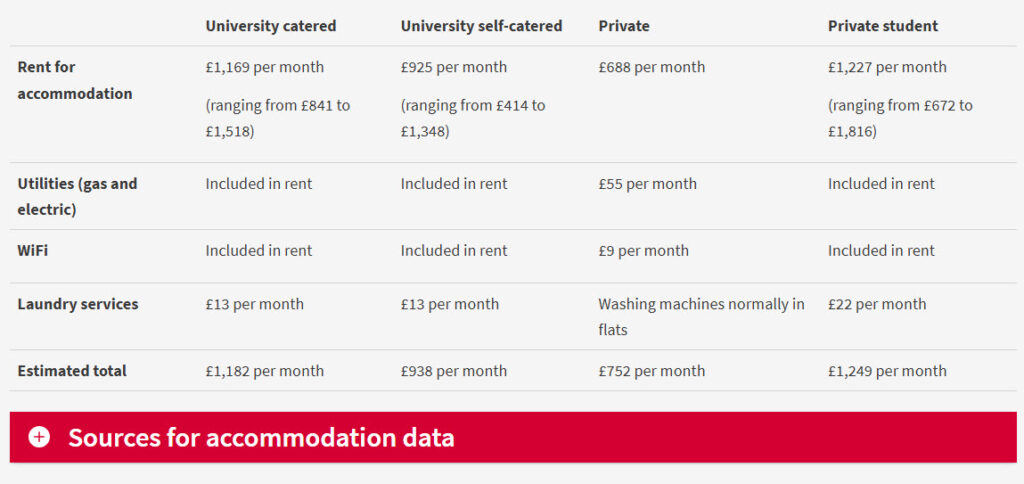
How the ‘Accommodation and utilities’ table and accordion was originally styled on the prototype undergraduate living costs page.
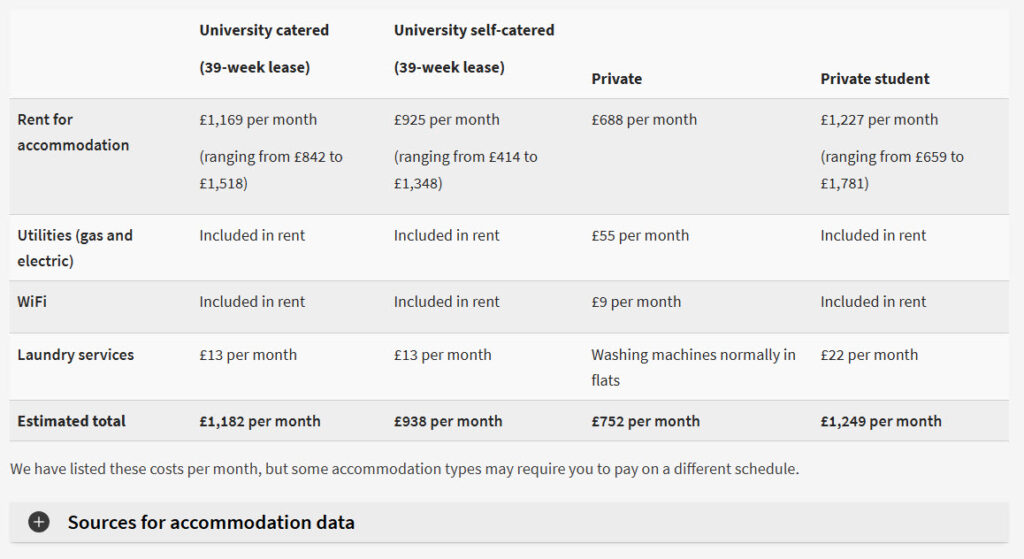
The new presentation following Aaron’s changes, with shading, a bolded ‘Estimated total’ row and a sources accordion with the correct heading level and non-primary styling.
Reviewing pages with subject matter experts
Throughout the process of designing and building the living costs pages, we were in communication with stakeholders and subject matter experts to keep us on the right track.
In addition to speaking to staff who help students with financial support for living costs, we also reviewed the content within our team, and came away with new ideas, including adding guidance about council tax for students.
Close to the end of this phase we were also able to gain some valuable insights from two of the Students’ Associations Vice Presidents (Community and Education) about student experiences with private accommodation.
The main takeaway from this meeting was that, despite only studying for nine months out of the year, many undergraduates end up renting properties for 12 due to:
- high competition for flats in Edinburgh, making students feel as though they have to rent over the summer to hold onto a room
- landlords being more likely to rent to students who want to stay for a longer period (despite the fact that Scottish tenancy agreements are open-ended with no minimum or maximum period)
With this in mind, we updated the content on the undergraduate living costs page to highlight that, after Year 1, many undergraduates are likely to rent in Edinburgh year-round. We also expanded the ‘Estimated totals’ table, which previously only listed figures for a 39-week academic year, to add figures for a 52-week year.
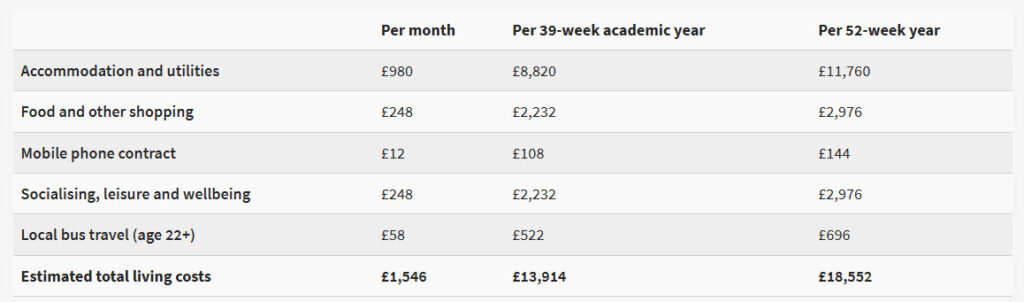
Estimated total living costs table on the undergraduate living costs page, showing figures per month, 39-week academic year and 52-week year.
Writing up guidance for our operations team
The final step in this phase of the project was to write up guidance for our content operations team, who – now the pages are published – will update costs and guidance each year.
We have produced step-by-step instructions and a spreadsheet pre-populated with formulas, which will allow them to update the figures accurately and efficiently.
Lessons learned
While we are happy with how this phase of the project has gone, there are definitely some areas for improvement.
The primary change going forward will be a more organised and unified approach to calculations (something we have already put in motion with our ops guidance).
During the calculations process, we went back and forth on how we arrived at figures due to each person in the team taking a slightly different approach, gathering data in separate locations and not always keeping clear records of how numbers were sourced. This meant the process took longer than it should have, and errors and discrepancies were allowed to creep in.
We also could have benefitted from speaking to certain subject matter experts earlier in the process – although in projects of this nature, it can often be difficult to align schedules with busy colleagues to make time for meetings.
View the new pages
Living costs for undergraduate study
Living costs for postgraduate study
What’s next
Since updating the living costs pages, we have moved onto designing and developing pages that will help applicants calculate their total cost of study. We’ll be publishing a blog on this phase of the project soon.
In the meantime, please get in touch if you’d like to learn more or to share your own experiences with creating living costs content.