
Bringing focus to our findings: continued user research for the API Service
Having developed a detailed picture of users’ needs when working with APIs, we used workshops to bring focus to the findings and prioritise next steps for the API Service.
In the first phase of user research for the API Service we created personas and journey maps based on insights we gained through one-to-one interviews and user engagement workshops.
User experience research for the API Service — read the blog post about the first phase of research.
The second phase of the research brought focus to this detailed picture.
This blog post will cover the following steps we used to reach this point of focus:
- Review workshop
- Addressing additional research questions
- Follow-up user engagement workshop
- Establishing priority pain points
- ‘How might we’ statements — to solve prioritised problems
- Bringing it all together
Review workshop
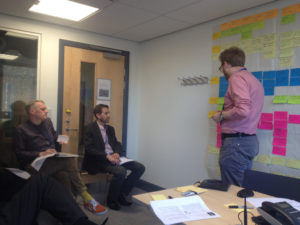
Presenting initial findings of the research to the API Service team.
We held a review session with the API Service team, to present our findings from the first phase of research. This was to validate the findings from a business perspective, and to shape the direction and scale of the research to be carried out for the remainder of our collaboration.
I presented our findings to representatives from the API Service and other stakeholders, and I introduced the personas and the journey map.
The nature of the journey when working with APIs depends very much on who you are and the nature of your project. So by necessity, the map contains a great deal of detail. This is potentially overwhelming to people who encounter it for the first time.
So, taking inspiration from Nick Daniels’s brilliant storyboard for the work he has been doing on BI/MI tools, I produced a cartoon version of the journey map.
Presenting findings from user research into BI/MI — read Nick Daniels’s blog post.
The storyboard condensed the journey map to its core message. This brought the journey map to life, making it easier to digest. By enabling people to quickly understand the key points of the journey map in an accessible format, we have encouraged people to interact with the deeper detail in the journey map itself.
Addressing additional research questions
The second phase of research was partly about verifying our findings with some additional user engagement. However, the API Service had some additional specific questions they wanted answers to.
I found that these areas of focus could be phrased as pain points that each fell neatly into different phases of the journey map. So I designed the workshop to enable participants to validate and prioritise the pain points in the customer journey map.
This allowed us to flesh out answers to the questions the API Service wanted answers to, without priming the participants too much (and consequently biasing the results).
We were also tasked with finding out what features of the API Service would attract potential users who do not currently work with APIs. So we broadened the framing of our research to talk about the core problem — pulling data from one system to another — rather than the specific solution of using an API.
Establishing priority pain points
Workshop participants worked with a simplified version of the journey map, to validate our earlier findings. Only minor changes were made to the journey map, suggesting that it is indeed an accurate reflection of people’s experience.
But notably, a few extra pain points were added. By this stage, we had identified 27 distinct pain points throughout the journey of pulling data from one system to another.
Participants then voted for which of those pain points they most wanted to see addressed. Tellingly, this also strongly backed up our initial finding as to which stage of the journey was the most painful — and which was the least painful.
The area of least pain was not necessarily clear to the API Service team. In fact, this area of relatively little pain was one of their main areas of concern going into this research. However, users have told us time and again that this one particular stage in the journey is the least painful part of the entire process.
“As a result of this user research, we now have a strong sense of where we need to focus our future effort as the API Service develops. Collaborating with the UX Service to embed user-centred techniques and insight within the project team has been an important step towards ensuring the future success of the service.”
— Susan Cooke, Enterprise Data Services Team Manager
The “how might we” method to problem solving
With the top pain points established, we flipped them on their head by turning them into “how might we” statements to be solved. So the pain point of knowledge not reaching the right people became: “How might we ensure knowledge reaches the right people?”
The “how might we” note taking method — Design Sprint Kit.
This gave us an insight into how users of the API Service expect their needs to be addressed. After another round of prioritisation, a clear winning idea emerged.
Collaborative sketching
Participants then collaborated on sketches for how the most popular idea might work in real life.
Many people — myself included — dread being asked to draw. But this exercise is not about artistic skill. It is a way to get a deeper insight into how people imagine a solution might work.
It is incredible how many detailed ideas can be created in a short space of time. That is especially the case if you scale the exercise up to 60 people, as Neil Allison once did at a Learning, Teaching and Web Division away day.
Research through design sketching scaled up.
But even more powerfully, the format — of sharing ideas, then borrowing ideas from other people in additional rounds of sketches — enables people to converge on a particularly strong idea quickly.
We don’t get people to sketch these prototypes in order to prescribe a solution. This is all about getting an understanding of how people conceptualise in their own minds what their problem is, and how it might be solved. But it’s up to us to interpret the outputs and understand what the ultimate solution might be.
Bringing it all together
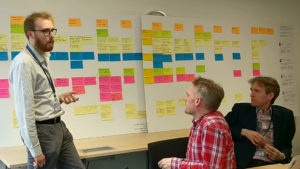
Presenting findings at the end of the second phase of research.
By this stage, we had gathered insight from 20 potential users of the API Service, representing various roles in several different areas of the University.
From this, we created personas that capture the range of attitudes and behaviours we discovered. We also built a journey map that outlines the stages people go through when working with APIs.
We then worked with potential users of the service to prioritise the pain points to identify the key areas that need attention above all else. Having identified those priority pain points, we then asked users to generate ideas for how we might address them.
In doing so, we have brought focus to a complex problem area. We have condensed a highly detailed picture to understand which pain points need to be addressed with the most urgency — and how they might be addressed.
Next steps
Having identified priority areas to be addressed, the next step is for the API Service team to develop hypotheses about how they can solve the pain points, through Lean UX hypothesis statements.
Lean UX – requirements are hypotheses.
By creating personas based on our observations of users, determining the main pain points, and generating solution ideas directly from users of the service, we have given the API Service team a solid foundation upon which to build these hypotheses and effectively direct their effort as they develop the service.
Get in touch
If you would like support conducting user research to enhance your service or project, get in touch with the User Experience Service.