
User journey maps for prospective students: a new resource for University student recruiters
We’ve distilled our understanding of prospective students into user journey maps so that we can share our insights with the University community. Over the past 3 years, we’ve conducted a great deal of research into the prospective student experience through the work to transform the degree finder and explore the future of open days.
Sharing the maps and the best way to use them
In this blog, I’d like to share some background on how we created the maps and how best to use them. I’ll also share links to the blogs that contain each user journey map created. There is one for prospective undergraduate students, one for taught postgraduates, and 2 for PhD students. I’ll cover:
- What a user journey map is
- How we’ve created them
- Why use a user journey map
- The best way to use a journey map
- Links to the blogs for each user journey map
A journey map is a visualisation of a process from the users’ perspective
According to the Nielsen Norman Group:
“A journey map is a visualisation of the process that a person goes through to accomplish a goal.
In its most basic form, journey mapping starts by compiling a series of user actions into a timeline. Next, the timeline is fleshed out with user thoughts and emotions to create a narrative. This narrative is condensed and polished, ultimately leading to a visualization.”
The visualisation takes the form of a grid with columns for each high-level stage in the journey that – The ‘actor’ – the person carrying out the journey, is taking. There’s a row each for:
- Steps to achieve the goal for each stage
- Emotional journey
- Thoughts that people have at each stage
- Opportunities for the institution to improve the user experience
A user journey map is sometimes referred to as a customer journey map, as shown in this example:
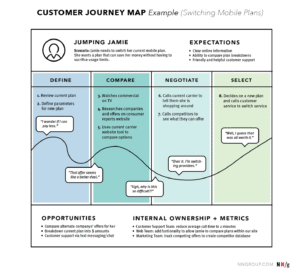
Journey maps come in all shapes and sizes. Regardless of how they look, journey maps have the following 5 key elements in common: Actor; Scenario and Expectations; Journey Phases; Actions, Mindsets, and Emotions; Opportunities.
Source: Journey Mapping 101 by Sarah Gibbons for Nielsen Norman Group
Our prospective student user journey maps
- Prospective undergraduate user journey map
- Prospective taught postgraduate user journey map
- Prospective postgraduate researcher user journey map
How we created the prospective student user journey maps
First, we created an experience map from the many stakeholder interviews and workshops carried out during the design sprints that preceded our work on the degree finder transformation project.
Summary of our work on design sprints
Write up and video of our initial experience map work derived from design sprints
We created this map as a way to consolidate the user research insight we were gathering to inform our design sprints.
We used that map to inform our research planning and then created updated user journey maps based on the research insights we subsequently gathered.
The research data came from interviews and workshops with current and prospective students who took part in the user research for the degree finder transformation project and the project exploring the future of open days and site visits.
In our user research for the degree finder transformation, we focused on learning how prospective students go about finding and applying for a degree programme, where they succeed and where they encounter difficulties.
In our University Open Days research, we explored how people currently use these events, which provided further insight into the student journey and ways to evolve the Open Day format.
We learned:
- When prospective undergraduate students start the process of looking for a degree programme
- Useful information about the prospective student context – where they are in their lives during the user journey
- How they begin the process
- The touchpoints on the user journey
- Whether certain touchpoints in the journey are more beneficial at different times
- Opportunities for the University to provide the most relevant online information and communications and events
During both projects, we summarised the insights and collaborated with team members to translate those insights into actions. This didn’t require a visualisation; however, we recognised that the information would be valuable to the wider University community, and in that case, a visualisation would be beneficial.
I want the extensive user research undertaken through the degree finders transformation to live beyond this project. We’re hoping our prospective student journey maps will support colleagues’ decision making in University student recruitment and marketing for years to come.
Neil Allison
Head of Prospective Student Web
Why use a journey map based on user research?
People using a website or service often behave differently from the expectations of those providing or running it. A user journey map grounded in evidence and insights into user behaviour can help prevent a mismatch between the target audience’s expectations and needs and what we deliver by providing a shared vision for services to align their provision with.
Again, according to the Nielsen Norman Group:
“Fragmented understanding is a widespread problem in organisations because success metrics are siloed; it is no one’s responsibility to look at the entire experience from the user’s standpoint.”
Prospective students don’t perceive their many different touchpoints with the University as separate services; instead, they view their contact with the University as a single, integrated experience.
The institution’s organisational structure can mean that staff focus on a particular area of responsibility. However well those services are provided, this structure can lead to a silo effect. What we learn about students, our metrics, and ways of interacting with them can remain within the distinct services.
This can lead to a fragmented understanding of the audience across the institution. This filters into communications and online provision and confuses prospective students. We saw examples of this at the start of the design sprints: circular journeys and duplicated online material, which made it unclear what the correct information was and who to contact for particular information.
A user journey map can alleviate this by fostering a shared understanding of the target audience and the steps in their journey, enabling staff from different services to align their service provision to the same shared vision.
For staff to align their provision to the same evidence-based journey map means keeping a bigger picture in mind. This doesn’t mean taking focus away from their service provision. Instead, it means viewing their service provision as part of an integrated whole, which is how prospective students encounter it.
Seeing the journey mapped from the student’s perspective can make the interconnectedness of services more visible and can support staff to coordinate service provision across departments more effectively, reduce the silo effect and enhance the experience for prospective students.
A user journey map can complement an internal process map
An internal process map shows us what we’re doing operationally when running services. A user journey created from user research shows how people try to access those services.
Cross-referencing the process map with the user journey map can help identify where internal processes can be streamlined to improve internal efficiency and more effectively support prospective students. It also provides greater confidence to continue current processes which are aligned with the user journey.
User journey maps are a ‘living’ resource
These maps are based on recent user research and need to be updated as we learn more about our target audiences.
The maps are not a ‘final destination’. They work best when staff discuss and use the content to modify their activities, collaborating across disciplines and services.
Areas for future research to expand the maps
During our research, we observed several sub-groups that would be useful to map the user journey for; however, we didn’t have the necessary representation for them in our pool of user research participants.
Prospective postgraduate online learners
The journey to apply appeared to be the same as for on-campus students. However, we didn’t have enough participation from online students to determine the nuances of their motivation to study. It is possible that their journey could overlap with those looking for a short course or flexible study, and it would make sense to explore this overlap in a dedicated piece of research.
Prospective international students, both undergraduate and postgraduate
Again, the journey steps appeared to be the same as for domestic students, with the addition of some actions specific to the international audience: applying for funding and using an agent to find courses and help with the application process.
It would make sense to explore the specific audience needs in a dedicated project and to consider the overlap with postgraduate online learners.
Widening Participation students
Widening participation research participants vary widely in profile, including those with physical accessibility needs, mental health needs, and those who have not attended university before.
Some people in this group have specific requirements that require dedicated information provision, and the group overall has unique requirements that would be best explored in a dedicated project.
The offer holder experience
In our research, we asked people about their experiences as offer holders and captured what we learned in the maps we produced. However, we did not prioritise exploring this journey stage. We can see from the learning that a dedicated project would be useful to inform the nature, content and timing of communication with people at the Offer Holder stage.
More about our prospective student user journey maps
This post is part of a series:
- Overview: Why it’s useful to have user journey maps and how best to use them
- Prospective undergraduate user journey map
- Prospective taught postgraduate user journey map
- Prospective postgraduate researcher user journey map
Related reading
Back in November 2021, we ran a short event where I shared our work-in-progress on learning about the student experience during the design sprints and why we were mapping student experiences. I shared our insights visualised as an experience map. If you would like to revisit that event, University of Edinburgh staff can access the event recording and slides through the links in the blog.
There are some excellent resources available if you want to learn more about user journey maps. I’ve referenced articles by Nielsen Norman Group in this post:
Journey Mapping 101 by Sarah Gibbons for NNg
How Practitioners Create Journey Maps: Typical Uses, Roles, and Methods by Kate Kaplan for NNg
Some other useful resources:
User journey mapping workshops by David Travis for userfocus.co.uk
The Power of Experience Mapping by Jared Spool
Scenarios and Journey Maps Help Designers Become Storytellers by Jared Spool