
Appraising the new postgraduate study website: a scorecard approach
We recently reviewed the new postgraduate study website with 17 students, using a summative usability testing approach to produce a performance scorecard. While there were aspects of the site that performed well, we identified areas that need further improvement.
Why are we measuring performance?
The University should look at this [project] as an exemplary example of many departments working together for a positive output, not only for staff but also for end users – School of History, Classics and Archaeology
It’s been great to get such positive feedback from around the University in response to the new postgraduate taught study provision but how do we know if it’s performing well enough for our prospective students?
To answer this question, we wanted to appraise the performance of the website for the most important tasks we know postgraduate taught prospective studetns need to complete.
The scorecard approach
We use a scorecard approach recommended by Lou Rosenfeld.
We used a scorecard approach to summarise our findings derived from Lou Rosenfeld’s article: Stop Redesigning and Start Tuning Your Site Instead
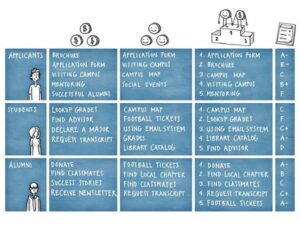
In Lou’s example we see the target audience in the first column. If we follow the example of applicants, we see in columns 2 and 3 a list of tasks. Tasks listed in column 2 are important to the business and tasks listed in column 3 are important to the user.
Column 4 shows an amalgamated set of priorities which is achieved through a negotiation between the tasks in columns 2 and 3. This list is small since we can’t test everything and because there is only a small number of tasks that are disproportionately important to both.
In column 5 we see the grades that each task was given after the appraisal was completed and shows us where our attention should be focused if we want to improve our website.
How do we identify what our top tasks are?
Our team has conducted a large amount of user research over the years and by reviewing this insight we can identify what top tasks are for our users.
Our main source of insight has been the top task survey from 2018 – although a new survey is currently collecting responses and will start producing insight early this year. These surveys are large datasets that capture over 3000 responses across different demographics and let us know that small list of tasks that are important to prospective students.
We validate this insight with other research we’ve done such as 1-1 interviews where we explored the experience of applying to university and card sorting exercises that help us understand how students expect information to be categorised.
To help us understand what tasks the University wants prospective students to be able to complete we took advice from Ewan Fairweather, Postgraduate Student Recruitment Manager in Student Recruitment and Admissions.
Capturing more statistically significant data
Students
The typical approach to usability testing recruits 5 participants for a study because usually our interest is in identifying the main usability issues which can be learned with a small sample group.
To obtain metrics that we can measure and to obtain more statistically significant data we need to recruit around 20 participants.
The first approach with the small sample group is known as formative usability testing whereas the one with the larger sample group is known as summative usability testing.
Formative vs. Summative Usability Testing: An article by Alita Kendrick for Nielsen Norman Group
Because recruitment is challenging, especially when looking for genuine prospective students, we ended up with 17 participants in our study.
The study comprised of:
- 6 undergraduate students currently studying at Edinburgh, and interested in postgraduate study. All were from the UK.
- 11 prospective postgraduate students applying for 2026 entry of which 5 were international and 6 were from the UK.
Subjects
The higher number of participants also helped ensure we captured a wide range of programme profiles across different subject areas.
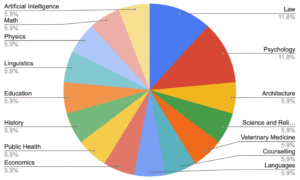
Composition of different subject areas covered in this study
We tested with students interested in programmes predominately offered by the College of Science and Engineering and Arts Humanities and Social Sciences. We only tested one from the College of Medicine and Veterinary Medicine, which was for Veterinary Medicine.
Establishing measurements to calculate our usability metrics
To establish metrics that we can track over time and demonstrate ongoing improvement in the website’s performance, we need some standardised measurements.
To achieve this, we appraised the website against the three areas that define usability:
Effectiveness: Measure the number of participants that complete each task by meeting our established criteria for success.
Efficiency: Measure the time it takes each participant to complete the task.
Satisfaction: Measure the number of times participants tell us that the information for a task does not meet their needs.
Where the definition of usability comes from: An article by Jim Lewis and Jeff Sauro for Measuring U
Our scorecard
The report card we produced with each task graded according to measured performance.
| User needs and business goals amalgamated | Grade |
|---|---|
| Degrees available (Does Edinburgh offer something I want to do?) | A |
| Entry requirements (How likely am I to be offered a place?) | B- |
| Fees and total cost of study (How much will it cost?) | C+ |
| Degree content (What will I study as part of the degree?) | B |
| Careers (What might I do after graduating?) | C |
| Sources of funding (Can I afford to study?) | D |
| Application process (When will I receive a decision?) | B+ |
| Capacity to work (How much time do I need to commit?) | D |
How we graded each task
Grading is of course subjective, but we needed a criteria to grade our tasks by. We first established a grading range from A to D. Grades A to C were given boundaries (e.g. if between 75-90% met our criteria for effectiveness then we awarded a B) and any grade below a certain value (e.g. if less than 50% of participants met our criteria for effectiveness then we awarded a D).
We applied this grading to each of the three performance metrics (effectiveness, efficiency and satisfaction) and then weighted each of these three grades equally to produce an overall grade for each task.
Why we didn’t score all A grades
You might think that with a new service, with extensive user research and usability testing that it would diver a straight A scorecard.
The results show that there is still room for improvement but crucially the appraisal highlights why certain areas are performing worse than others. Our team is committed to continuous improvement which is our focus for 2026 and beyond. Appraising and sharing our findings is an important part of that work.
Where we can improve
Entry requirements (How likely am I to be offered a place?) = B-
We wanted to know if participants could identify the different grades and conditions they would need to meet to apply.
- Some of the international students told us it was challenging to navigate through the postgraduate entry requirements website due to the volume of information that wasn’t relevant to them.
- They would have preferred to have the information that was relevant to them presented on the programme page.
Fees and total cost of study (How much will it cost to study?) = C+
We wanted to know if participants could accurately calculate the total costs they would need to meet for a year of living and studying in Edinburgh.
- More than half of the participants couldn’t calculate the cost of living because they couldn’t understand the figures presented to them.
- The wide range of costs made it difficult for them to know how much they would actually pay.
- Some noted that costs at the lowest range were not realistic and costs at the higher high seemed to high with the real amount likely being somewhere inbetween.
- Some participants told us it was difficult to calculate costs because the information was spread across different webpages.
Degree content (What will I study as part of the degree?) = B
We wanted to know if participants could identify the names of two courses they would study and what they would be taught on each of them.
- Most participants were able to identify the names of two courses they would study and what they would be taught on each of them.
- They achieved this by clicking on the link from the programme page to the DRPS website.
- Most told us that while the information on the DRPS is useful it is diffiuclt to navigate and they would prefer to have the information presented to them on the programme page.
Careers (Does the degree meet my career aspirations?) = C
We wanted to know if participants could find information that would give them confidence that the programme would meet their career aspirations.
- 15 out of 17 participants told us that the information they were being presented with in the careers section of a programme page did not give them the confidence that the programme would help them meet their career aspirations.
- They told us that the information was too vague.
- They wanted to see more detailed information based on data that showed them the percentage of graduates who went on to work in certain roles and for certain companies.
Sources of funding (Can I afford to study?) = D
We wanted to know how easy it was for participants to identify two things. Firstly, that multiple sources of funding would need to be considered to meet the costs of their study and secondly, a list of funding opportunities available to them based on their eligibility criteria.
- Only half the participants noted the information on the programme page that told them they would need to consider multiple sources of funding.
- All participants explored the Scholarships and Student Funding website.
- No participants were able to identify a complete list of scholarships they were eligible for.
- Majority of participants noted that they were seeing funding opportunities that weren’t eligible for and thought it would be a waste of time to search through them all.
- No participants clicked the link to the scholarships search tool.
- When asked to explore funding opportunities in the search tool participants noted that were seeing more funding opportunities they weren’t eligible for leaving them confused at why there should be differences between the search tool and the website.
- Some participants told us they had seen funding opportunities from other online sources that were not being displayed on the University website.
Application process (When will I receive a decision?) = B+
- We wanted to know how if participants could identify when they would need to apply and when they would expect to receive a decision.
- All but one participant could identify the date they needed to apply.
- Two thirds of participants were able to identify the date when they would receive a decision.
- One third of participants were not able to identify when they would receive a decision because the information was not on the programme page.
Capacity to work (How much time do I need to commit toi studying?) = D
We wanted to know how if participants could find information that would tell them how much time they would need to commit to their studies.
- Only one participant could identify the time commitment required because the information was not present on any of other programme pages.
Why improving content is so important
The new undergraduate and postgraduate taught study provisions have been designed with insight from user research to ensure that it is easy for prospective students to find the information they are looking for and that it’s where they expect it to be.
The good news is that this is what we observed in this study.
97% of participants went to the right section of the programme page to complete each of the tasks and they got there quickly.
The main contributing factor to the lower grades across all tasks is the quality of content. This significantly impacts our grades because it means participants were taking longer to find the information in the section they navigated to because it wasn’t there or if it was it wasn’t meeting their needs which subsequently reduces their level of satisfaction overall.
For our degree profiles, it’s clear that the next priority to support prospective student decision making is to enhance content in priority areas and to achieve this we need to work closer with colleagues across the wider university community.
Building on what we learned from this appraisal
While this type of approach is effective in helping us identify areas where improvement is needed it is also resource intensive meaning it’s not practical to keep repeating.
To continue the appraisal process I will work with Carla, the performance analyst in our team, to use quantitative insight across different areas such as enquires and website analytics.
It’s a more cost effective approach and will help us measure the level of improvement that future enhancement projects have and ultimately start improving our grades.
What next?
When Neil surveyed the University’s student recruitment and marketing community last year it helped to establish a set of prioritised areas where enhancement work needs to take place.
Our focus for 2026 is driven by this insight so we will be focusing on qualifications by country, cost of study, clearing and enquiry management.
Some of the issues identified in this appraisal will be addressed by this work, specifically issues related entry requirements and cost of living.
We have an extensive backlog of future enhancement work with all but one of the issues raised in this appraisal, which is improving content for what you will study, which will we’ll add.
You can see from the survey responses that Neil received that some of the areas raised by this appraisal are also priorities for the wider university community. I think it’s worth noting how highly scholarships and careers placed and their relative grades to show how much work still needs to be done to improve the prospective student experience.
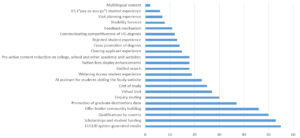
As is typical in top task surveys, a small number of items are identified as disproportionately important.
Learn more
We regularly share blog posts about our user research activities.
More posts about usability testing conducted by the Team