
Experimenting with Google Analytics 4 to improve website content
As a user researcher at the University, I plan and conduct research activities to help colleagues improve the content in their websites and services. Recently, I have been learning how to use Google Analytics 4 (GA4) to see what information it can provide about University websites and content.
Qualitative and quantitative data are both useful for improving user experiences
In the UX Service, we often use qualitative research methods to tell us if – and why – people are struggling to use University website content. Our research methods can include:
- User interviews
- Usability testing
- Surveys with open questions.
The data gathered from these methods is rich in insights, but we usually collect data from only a representative sample of users. These methods are also less likely to observe someone’s natural use of a website or service because they involve direct interaction with users.
Quantitative data can provide another view of how visitors are interacting with a website
One example of quantitative data that can be used for content improvement is web analytics.
Unlike qualitative data, website analytics indirectly collect information about a larger sample of visitors, such as which pages are viewed and how long people spend on a page. Since the data is numerical, it can be analysed and compared across different dimensions, such as page views across date/time or by visitor location.
However, the numbers don’t explain why users are behaving a certain way, which is why it’s best to have a combination of both types of research method.
I have been teaching myself about Google Analytics 4
The University previously used Universal Analytics (UA) data to learn about audience behaviour on its website. However, in 2023, Google upgraded UA to Google Analytics 4 (GA4).
The change has involved a steep learning curve for the Website and Communications (WAC) team because the terminology and methods of data collection have changed since the upgrade.
The WAC team are therefore not able to support GA4 training for University colleagues, so I have been teaching myself from various sources. Here are some of my learnings so far.
Looker Studio is an easier way to display GA4 data and create reports
I chose to use Looker Studio rather than the GA4 dashboard because I can start a blank report from scratch and create bespoke reports, depending on which webpages I am interested in. Looker Studio lets me import GA4 data, create tables and graphs and save a report so that I can share it with colleagues who don’t have analytics training.
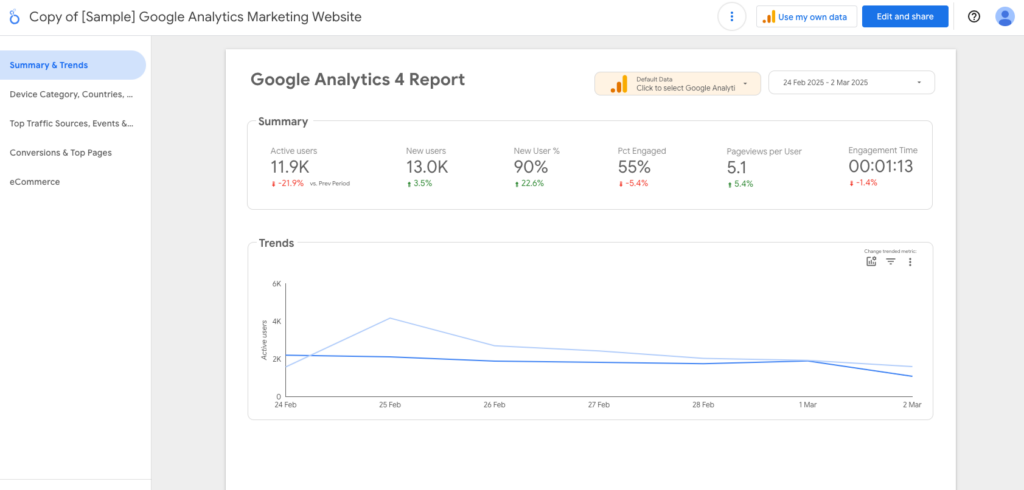
Screenshot of a sample Google Analytics report in Looker Studio.
While it took some time to learn how to use Looker Studio (and I’m still learning!), I prefer it to the Google Analytics dashboard because I usually only want to see a sliver of the data, rather than sift through numbers across the whole University web estate.
I’ve used GA4 to prompt ideas for further user research activities
Recently, when colleagues have contacted the UX Service for help with their website, I’ve used GA4 for some of the following information:
To get an idea of the most visited webpages.
These pages can indicate the types of tasks that the audience wants to complete on the website.
For example, when planning usability testing for the New Students website, we looked at a list of their top 10 most visited pages to check that these pages were prioritised in the tests:
DIY user research: Helping the New Students team optimise their web content
When measuring the environmental impact of the University’s web estate, our Green Digital interns found that homepages tended to be the most visited webpages, so prioritised these pages when estimating carbon emissions:
Exploring Digital Sustainability: Insights from the Start of My Green Web Estate Internship
To explore how long visitors are spending on each page.
This metric can often raise more questions than answers:
- What is a ‘good’ length of time to spend on a page?
- If users are spending over 30 seconds on a page, why could this be?
- Are visitors engaging with a lot of content? Or are they lost and struggling to find the information they need? These are areas for further research and testing.
To see where visitors are clicking on the most popular webpages.
Are users clicking where we would have expected?
For example, when investigating the UX Service website, we noticed that over the course of the year, video content was hardly ever played. This prompted us to question if video content was still needed and could be removed to reduce the size of our website:
To see if some pages receive more visits at certain points of the year.
Do audience needs change throughout the academic year? Is an event or new source driving visitors to a particular page on the website?
For example, when exploring how and why people are looking at staff profiles, we found one profile received a substantial increase in pageviews overnight. After further investigation, we found that the profile had been linked from a news article, which gave us more insight into how staff profiles can be used.
There are limitations to GA4, so it’s useful to look at trends, not absolute numbers
There are some key caveats to using GA4 data:
Google Analytics will not display data from visitors who opt out of cookies
It’s not clear what proportion of visitors opt out, but recent usability testing in our team has indicated that many students have negative attitudes towards being tracked with analytics cookies.
Therefore, it’s reasonable to assume that we are only looking at a small proportion of website visits, so it would be misleading to use metrics like page views to judge the success of a webpage.
Google Analytics numbers fluctuate depending on when and how they are viewed
I have been teaching myself how to use Looker Studio and Google Analytics, so it’s difficult to find explanations on the variations in data. As a result, I’m wary of trusting absolute numbers and prefer to look at trends in the data to inform further research activities.
I have used Google Analytics to supplement user research activities, not replace them
Due to the limitations of GA4, I would not rely on this data alone to make decisions about web content. However, I have used it to prompt further research questions and test these with other research methods, such as usability testing, to provide more reliable information about how visitors are using web content.
GA4 is also only one example of a quantitative data source, and there could be other sources that might be more appropriate to use, depending on the website or service being investigated.
Further reading
If you’re interested in reading more about Google Analytics, here are some links I’ve found helpful:
- Google’s official glossary which explains the terminology used in GA4. They also provide documentation for beginners and offer free courses in Google Analytics:
101: Get started using Google Analytics (GA)
- Hotjar provide plenty of clear information about Google Analytics, including a list of useful dimensions and metrics that you can compare in Looker Studio:
Hotjar’s Guide to Google Analytics Dimensions and Metrics
- The following article is aimed at users of gov.scot’s design system, but the advice and warnings for using analytics data are also relevant for our University web estate: