
Google Analytics segments
One of the best ways to get the most out of Google Analytics is by comparing two sets of data. This can be comparisons in time, actions, audiences or content. And the best way to do this is by using segments.
Why segments?
Segments in Google Analytics allow us to separate out website data, or to compare two sets of data side-by-side. Default reporting will show you the data for everyone who visited your site; it is highly likely that you should not be interested in that total pot of data. Instead, focus attention on your target audiences, and analyse that key information. Are the people who you are targetting:
- all in one geographical area/one city/one workplace (the University of Edinburgh)?
- spending a certain amount of time on your site/viewing a certain number of pages?
- viewing one key page – the course application, the event booking, the step-by-step instructions – or your contact page?
Once we identify our target audience, and what it is we want our users to achieve, then we can view the website use for those users and attempt to optimise our site to increase our ‘conversions’ (that is – the number of our target visitors who do what we want them to do).
Adding a segment
The segments area is located near the top of each report, immediately below the options for exporting data.
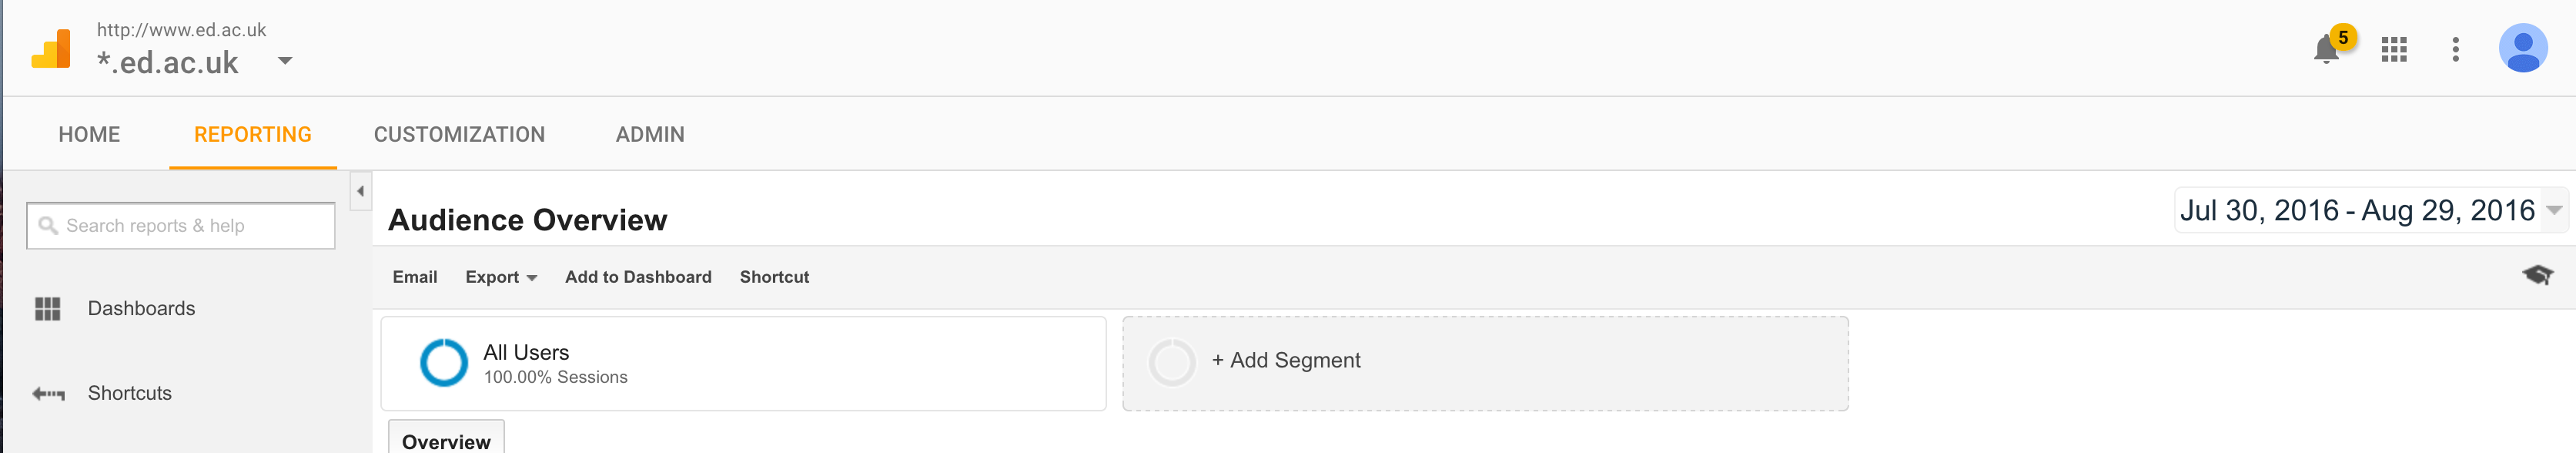
The segments area of Google Analytics
This area allows us to apply some default segments (some relevant to the University, some not), but also to create our own. There are many factors we can narrow the data down by:
- has the user visited a particular page/set of pages?
- how long did they spend on the site?
- where were they (city, country, continent)?
- what technology were they using?
And once we’ve narrowed down this data, we can start to think about what it means.
Putting segments into practice
Consider a site that contains a form that signs up visitors for a mailing list (a common task). If you are setting up a form, you should provide a destination page for once that form is complete to (a) confirm it worked, and (b) thank the visitor for completing the form.
If we set up a segment to show only the data for people who visited the form’s “thank you” page, what we’ll get an idea of is the pages they visited; in what order; how long they spent there; which pages they visited and didn’t use; and so on.
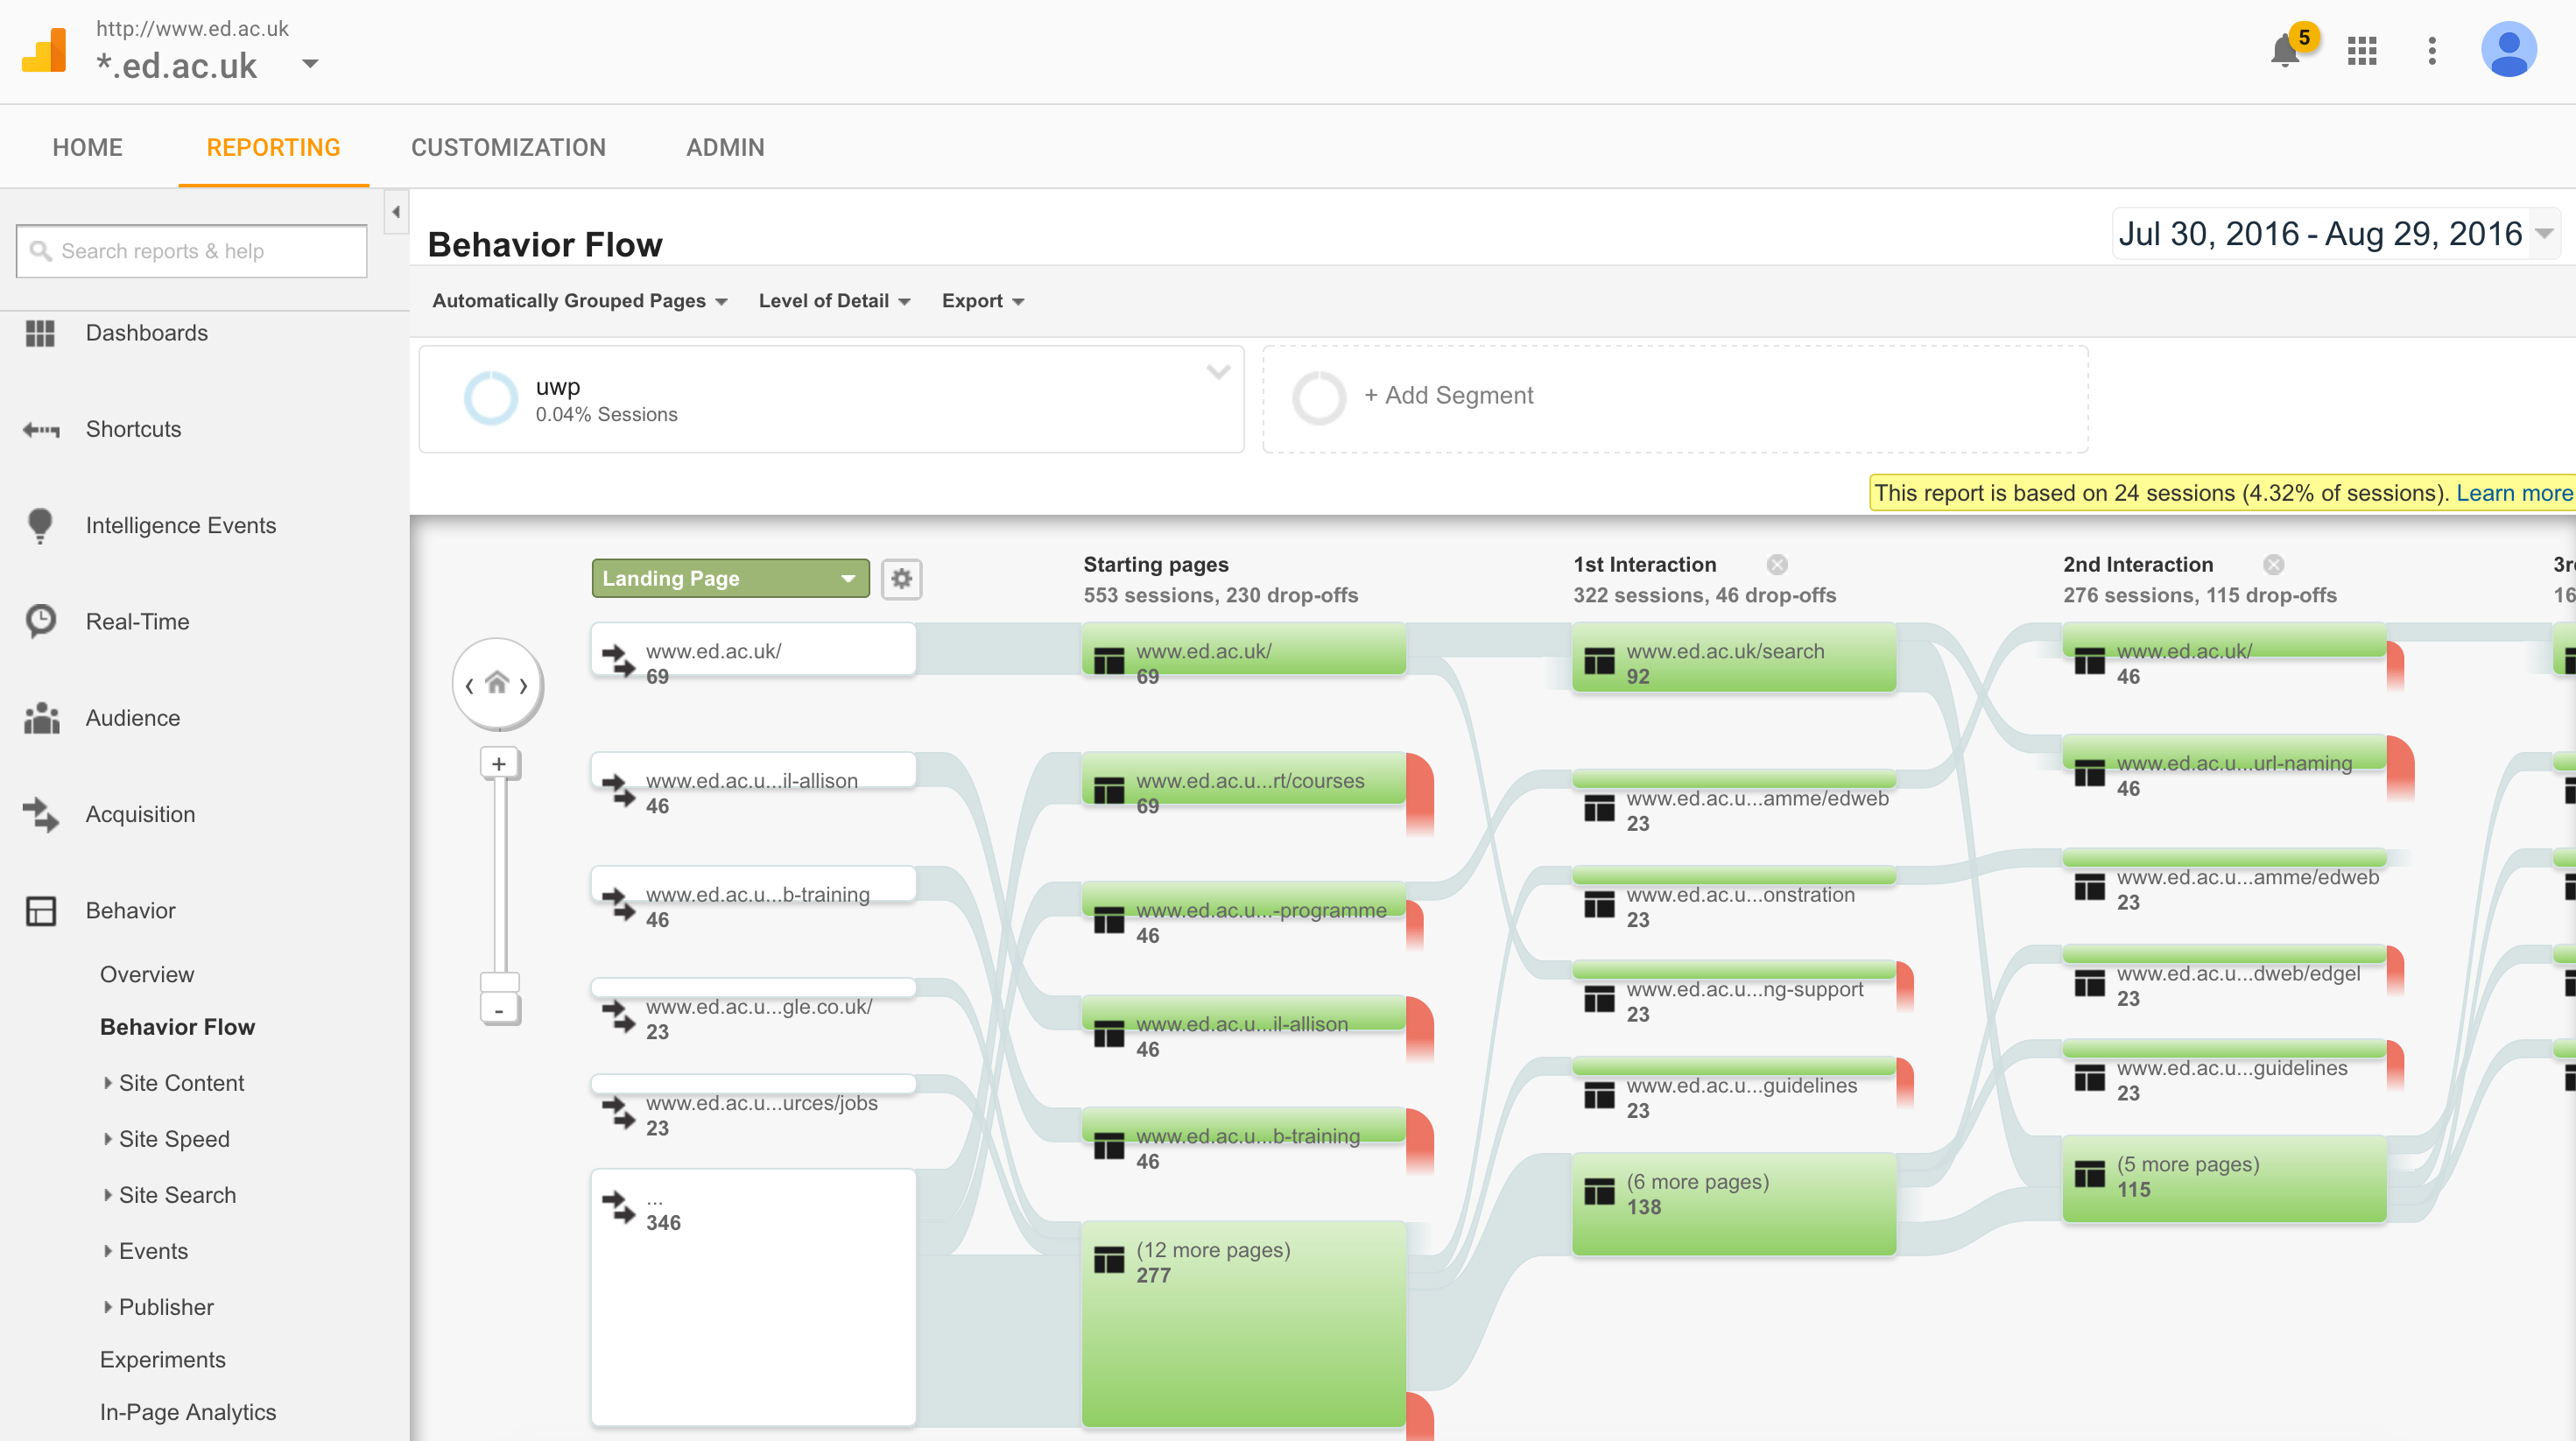
Visualising visitor flow for visitors to the University Website Programme pages
For pages our target audience used effectively (visitors spent time on those pages, or clicked through to the next step of our site’s journey) – are they prominent enough on our homepages/navigational pages? Could we promote them so that more people can use them?
If we knew that people who were interested in our services trended to find a particular page unhelpful, we’d need to reconsider that page. Is it using unhelpful language – is it poorly written/visually unattractive? Is it, in fact, unnecessary in the site – since those people we are targetting are not using it but still ‘converting’ (filling in the mailing list form)?
Where did we ‘acquire’ our target users from? Are they coming from particular sources (social media, through search, from other websites)? What search terms are our target users employing on our site – and are those keywords represented on the content we want them to find?
Alternative segment examples
If your site doesn’t have a form, consider segmenting by these other options:
- visitors who spent a certain time reading your site
- where people read desired pages in your site – the pages you want them to read to “succeed”
- visitors who come from within the University, or another city, or another country
- visitors that use a different default browser language
- visits from mobile devices
Or a combination of the above! There are a great many other options – the best one to use (as with so much of analytics) depends on what constitutes success on your site, or which visitors you are targetting.
Step-by-step instructions on how to apply segments, along with examples of how to achieve the above examples, are available on our support wiki.
University web stats with Google Analytics on the website support wiki (EASE login required)
3 replies to “Google Analytics segments”