
A delve into user behaviour in EdWeb-driven sites
For the past 12 weeks, I have undertaken website appraisal and analytics tasks as part of my internship as a CMS Support Intern with the University Website Programme.
I have evaluated the changes in user behaviour in the university-managed sites as a result of the project UWP006: New University-wide Web Content Management System (the move from Polopoly to EdWeb). To do this, I have compared the use in Polopoly-driven sites and EdWeb-driven sites. Ultimately, my findings suggest that EdWeb-driven sites provide a better user experience than Polopoly-driven sites, particularly in mobile devices.
Google Analytics
The tool that I have used to carry out the analysis is Google Analytics. GA is one of the most powerful web analytics tools in the market. It allows you to monitor and analyse traffic on your website. It offers an enormous amount of information such as:
- whether a visitor has been to the site before
- when they visited and how long for
- where they came from (organic search, direct link…)
Sites in the central CMS have code installed on every page on EdWeb, which sends information to the GA servers each time a page is visited.
Selection of sites and time frames
Given the vast number of sites managed by the university (over 300) and the level of detail provided by GA, analysing all of them would have been impractical. An analysis of a sample of sites revealed that sites of similar kind returned similar data and showed similar trends. I identified a selection of sites which includes Academic sites (from the College of Humanities & Social Sciences, the College of Medicine & Veterinary and the College of Science and Engineering), Staff sites, Student services sites, Student Recruitment and Exchange sites.
As the migration process lasted for approximately 18 months and the analysis should be at the level of individual sites, a period of six months at either side of the particular site’s migration date have been used to compare. In total, 38 sites have been analysed.
Metrics
The analysis of user behaviour has taken into account the target audiences for each of the sites. This includes staff, local and international students and UK based visitors.
The aspects that have been looked at for each of the sites include:
- percentage of returning visitors
- time on site for mobile, tablet and desktop users
- the use of search
- pages per session with and without the use of search
- percentage of mobile and tablet users
- bounce rate [1] for mobiles and tablets
Further investigation of other metrics has been performed in some cases.
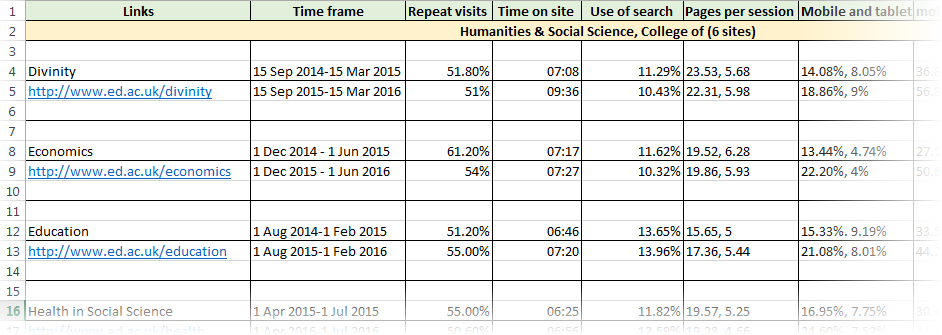
Collection of data in an Excel spreadsheet.
Findings
The analysis has suggested that the online presence of the University of Edinburgh has improved as a result of the new CMS, the creation of EdWeb. Data shows a steady increase in the use of mobile devices, including phones and tablets, although the tablet users percentage is broadly slightly decreasing or remains the same. However, this is a global trend.
To demonstrate, Student Services sites have shown an increase of 18% (see image below) in the number of mobile devices users, while Student recruitment sites has shown a 15% increase. This considerable rise in the volume of mobile devices users in student-targeted sites and progressive decline in the use of desktop, highlights an improved online presence and user experience as a result of the creation of EdWeb.
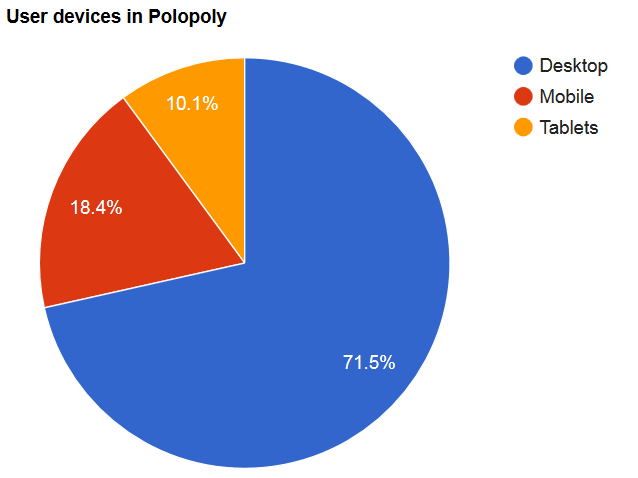
User devices among Student Recruitment sites in Polopoly.

User devices among Student recruitment sites in EdWeb.
The new information architecture and navigational structure has also enhanced the content organisation, allowing key audiences to find the information they need more efficiently. This is supported by the consistent increase in the use of search across all sites and a longer time spent on site. In particular, a 40% increase on time from mobile devices in Student Services sites is shown in the table below. This indicates users are starting to do a more in-depth reading on their phones, perhaps due to the more responsible and flexible design EdWeb has brought.
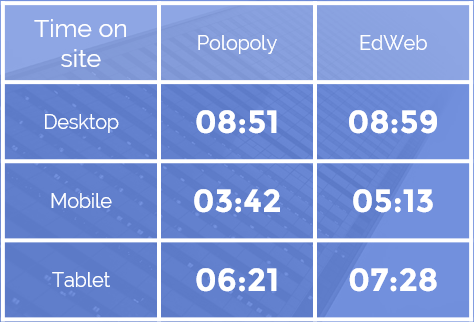
Time on site among Student services sites from Desktop, Mobile and Tablets.
It is also remarkable the huge improvement of 70% in the load time of mobile pages in EdWeb with respect to Polopoly. Polopoly did not offer mobile optimized pages, thus rendering very slowly in mobile devices or, in the worst case, not loading at all. EdWeb is optimized for all devices and screen sizes. It offers mobile-ready websites, providing a better user experience, especially in navigation and information architecture.

Mobile Load time in Student recruitment and Exchange Sites
Another trend I have picked up on is a consistent increase in the Bounce rate in a majority of sites. However, it is often the case that the time on site is higher, while the pages/session decreases and most traffic comes from organic search. The new content structure has facilitated the search experience, suggesting that the content is more readily accessible and users are finding the information they need directly. Although time constraints have not allowed further investigation of this, an analysis of the User Flow [2] for each of the sites could be suggested for future study.
Overall, it is clear that student-oriented sites are the ones seeing the highest benefit now, mostly due to the new responsive website framework. EdWeb better meets the need of key audience types for the university-managed sites, while keeping up with the rapid changes in technology.
A fond farewell
With the finalisation of the EdWeb analysis and the production of my final report, my 12-week internship has come to an end. I hope my delve into the figures and the insights into it that I have presented are useful for a measure of the UWP006: New University-wide Web Content Management System project’s benefits realisation.
Personally, I have thoroughly enjoyed my time here as a CMS Support Intern. The programme has offered me a great opportunity to grow and improve myself. I have learnt not only about analytics but also about Drupal, writing good content for the web and giving presentations confidently.
To everyone in the team, thank you for making the experience rewarding and memorable!
1. The bounce rate represents the percentage of visitors who enter the site and then leave (“bounce”) rather than continuing to view other pages within the same site.
2. The Users Flow report is a graphical representation of the paths users took through the site, from the source to the exit page, throughout all the visited pages. Study of this could reassure users are bouncing at very specific pages, rather than the homepage.