
Improving the top task survey for 2025
In 2025, the University of Edinburgh ran a new top task survey, having last run one in 2018. Improvements we made to the survey this time have resulted in our most confident understanding of what tasks are most important to prospective students thinking about applying to university. I’ll explore what these tasks are and how the improvements have helped us.
Top task survey method
The top task survey is a method established by digital strategist Gerry McGovern which seeks to identify the small number of tasks that are most important to users of a website or digital service.
I’ve written previously about this method and how valuable the insight we got from the 2018 survey has been for us.
My blog on the top task survey method and how we use it
Improving the top task survey for 2025
The top task survey was first run in June 2018 as part of a Service Excellence Programme initiative because the University wanted to learn what things were most important to prospective students.
In doing so, the University created the largest sample size of insight to date that told us which tasks were most important to this audience.
It’s insight that has been valuable to us as a team and has provided a sort of guiding light on where our focus should be on research activities we plan and what content we should be improving for prospective students.
Having said that the survey was not without some flaws in its execution and we wanted to address these in the design of the new survey.
Task list
It’s critical that people responding to the survey and voting on the tasks are viewing tasks that reflect their priorities and are easy to understand.
Insight from user research has helped inform the new task list but so too has consultation with colleagues from recruitment and admissions. Content designers in our team also peer reviewed the list of tasks.
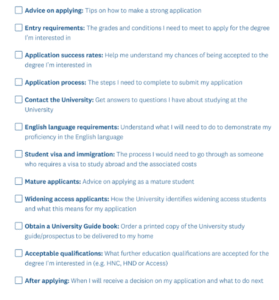
Each task is expressed in bold and includes an explanation of what it means
The randomised list that we present to each respondent displays tasks that are all at a similar level of granularity and expressed in a way that is easy to understand.
Demographics
We captured more detailed demographic information this time. It was important to know where each international student was living to allow a more granular segmentation of the insight. So, if we wanted to know, for example, what the priorities were for prospective postgraduates in China we could.
We also captured information about which part of the student journey each respondent identified as being on:
- Prospective student
- Applicant
- Offer holder
- Incoming student
- Advisor
- Interested (but not UoE)
- Other
We know that priorities change for students depending on where they are on the prospective student journey, so this helps us identify that.
To learn how these priorities are changing we’re running the survey at multiple points throughout the 2025/2026 academic cycle. For example, if we want to know what priorities are for offer holders, we have to run the survey at a point in the cycle when we know prospective students are holding and considering offers.
Another benefit of running the survey at multiple points in the cycle is the increases in response rate we get. With nearly 5000 responses so far, we expect to increase this to about 7500 by the time we’ve completed our runs.
Applying confidence intervals
When we look at the results of a top task survey we expect to see the long neck and tail.
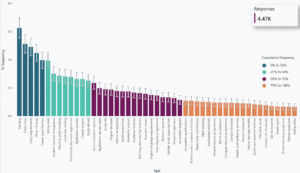
The long neck and tail of a top task survey
The tasks on the left, which is the long neck, are the most popular ones and therefore the most important. The tasks on the right are the least popular.
The first thing to notice is that all the bars have a line at the top of them. They are called confidence intervals. Basically, they’re the range of potential scores each task could get if we were to run the survey again. I won’t get into too much detail about how confidence intervals are calculated but it is something our performance analyst Carla calculated for us.
What they’re saying is that if we were to run the survey again there is a chance that the number two task, tuition fees, could become the number one task as you can see that the confidence bar for tuition fees overlaps slightly with the confidence bar of funding. But the bar for task three, entry requirements does not overlap with the bar of task one meaning that it couldn’t become task one.
Essentially, we shouldn’t get too hung up on the absolute positions of tasks as most could place a few places higher or lower if the survey was run again but applying confidence intervals lets us know just how far each could move and increases the level of confidence we have in the insight we’re capturing.
Comparing results between the 2018 and 2025 surveys
We were limited in the ways in which we could segment insight in the 2018 survey to all undergraduates, all postgraduate taught, international postgraduate taught, all postgraduate research.
So, the first place to start is to compare like-for-like segments of each survey to see any similarities or differences in the insight.
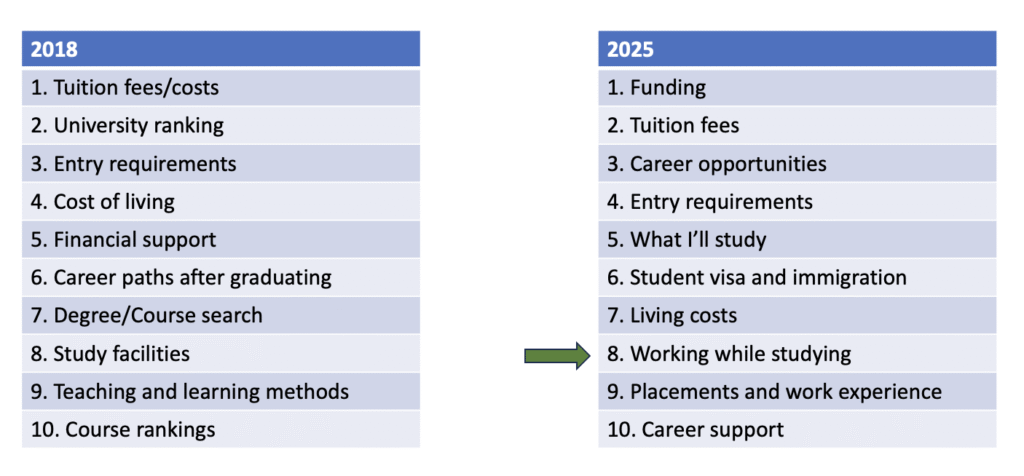
All undergraduate
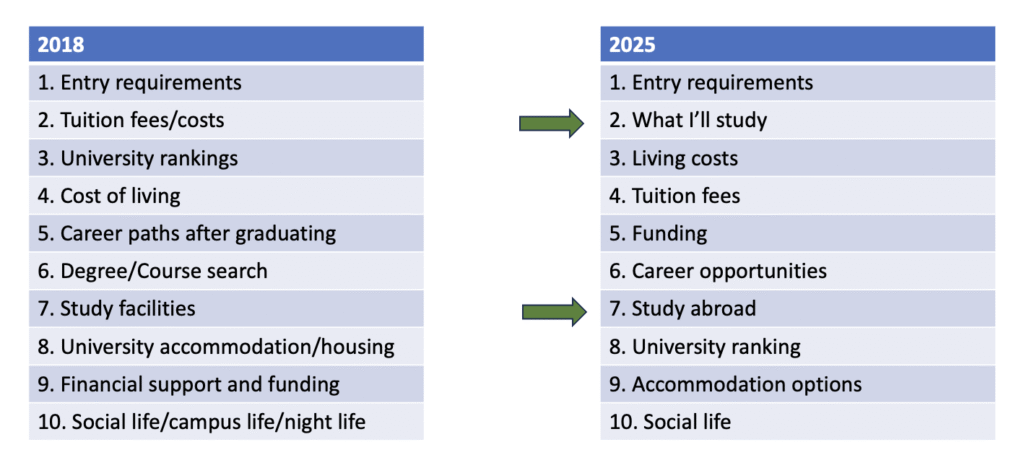
For all undergraduate students we’re not seeing any significant changes in task priority. We see a higher placement for what I’ll study which may be a consequence of improved clarity of expression with the same task being expressed as degree/course search in 2018.
The placement of the study abroad task at number 7, having moved up 12 places from 19 in 2018, is noteworthy. Having said that we don’t have any prior research or understanding of why that might be.
All postgraduate taught
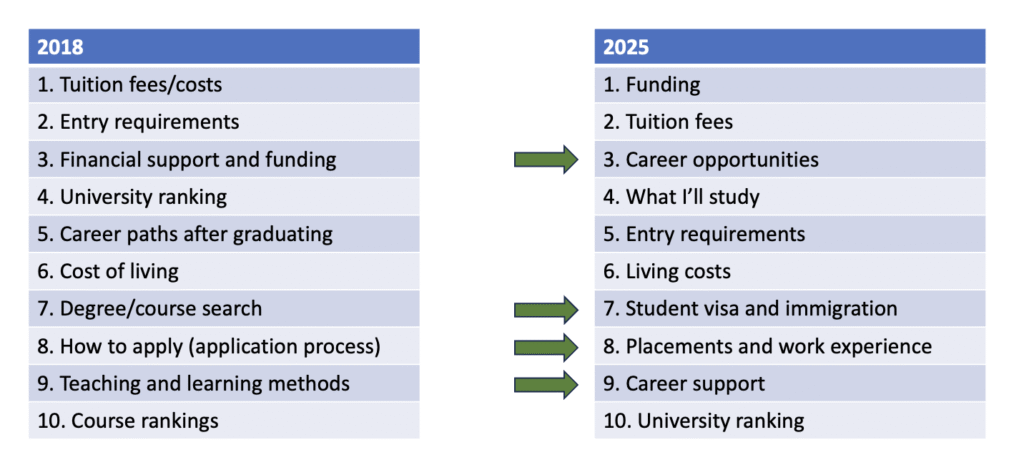
For all postgraduate taught students things get a little more interesting. Student visa and immigration has moved up 13 places from 20 in 2018 to number 7 now which is possibly a consequence of the changing political landscape since 2018 as it relates to immigration.
It’s worth keeping in mind that the majority of responses we have for our survey are from international prospective students which may be why it is placing so highly in the all postgraduate taught segment.
We’re also seeing placements and work experience place higher, having moved up 10 places from 18 in 2018 to number 8 now.
Career support is placing at number 9 now which is a task that didn’t exist on the 2018 list.
Career opportunities is sitting in a similarly high position now as it did in 2018. It’s not a surprise to see careers related tasks place so highly as we know prospective postgraduate students place high importance on this type of information as they consider applying and think about how a programme might meet their career aspirations and ultimately be worth the investment.
International postgraduate
When we segment all postgraduate taught audience to international only, we’re seeing broadly the same task prioritisation. The only difference is the placement of working while studying which has moved up 7 places from 15 in 2018 to number 8 now. This possibly relates to the rise of the student visa and immigration task as international students seek information on their opportunity to financially support themselves during their studies.
All postgraduate research
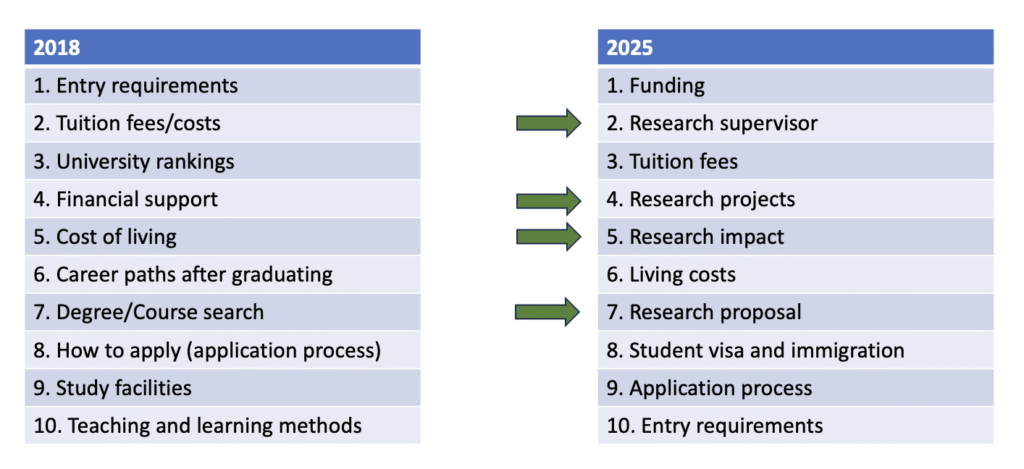
For all postgraduate research we see the biggest impact of improving task expression and granularity.
In 2018 there was only one task that was called research activities which is quite vague and doesn’t provide the correct level of granularity for this topic. This task placed at 18 in 2018.
As we can see, research supervisor, research projects, research impact, and research proposal are important tasks to this audience and all placing in the top 10. But this is only evident now because they were presented in the list to vote on.
Benefits of the 2025 top task survey
We’re compiling the biggest dataset we have on prospective student priorities using a proven research method and the insight we’re collecting this time round is more robust due to improvements we’ve made to the survey.
This insight helps our team prioritise our capacity for improvements because we can easily identify where the maximum return of investment for our effort will be to prospective students.
This survey has been designed to be of benefit not just to our team but to the wider university community.
But we have only looked at a limited segmentation of our prospective student audience. The survey will continue to collect insight throughout the 2025/2026 academic cycle and will be able to produce insight in a far more granular way than I have shown here.
Next steps
In the autumn, when the survey is completed, I will be producing more detailed insight for our different prospective student audiences so that we can see how priorities change across the academic cycle.
For example, some University colleagues may want to see what is important to undergraduate offer holders where others may want to see what is important to Chinese postgraduate prospective students.
Because of the way we’re capturing insight now we’ll be able to support our colleagues to obtain this type of insight.
I’ll no doubt be presenting on this insight so if this is of interest to you then keep an eye out in the autumn for upcoming events.