
Measurement strategy in Google Analytics
When it comes to deciding on your site’s analytics installation, you should consider the main objectives of your site, and the reporting capacity you have.
All sites within the University’s central site (in EdWeb, www.ed.ac.uk) use Google Tag Manager to deliver our measurement strategy (site owners don’t need to take any action).
If you’ve introduced something new to your EdWeb site and want us to check how it is being measured, please get in touch with our support.
Contact website support through the IS Helpline
What should we measure on our sites?
Measurement on our site should be directly related to either business or user goals. In practice, these will almost certainly overlap, and this is the intersection where we can derive key indicators of performance on our site.
The pages we produce are trying to shape your behaviour (sorry if that sounds disconcerting). So that we can concentrate on adding value to the services we provide, we’re trying to save staff time by providing a website that contains:
- self-service materials so that you can use our services without having to contact us (we want to reduce unnecessary support calls)
- lead-generating information so that you have a greater understanding of our services when you contact us (we’re reducing the time you spend answering our questions)
We need to understand how effective our content is, and how that relates to the enquiries we receive.
How far standard analytics can take us
A standard install of Google Analytics will be enough to cope with most of these objectives. But there are also in-page interactions that are important for us to understand.
For example, on our profile pages, we want to understand engagement (volume, quality of interaction, where visitors come from or go next).
But we also want to understand what sections of our profiles are most useful to our readers (so that we can reduce the sections that aren’t being read, and concentrate on the good).
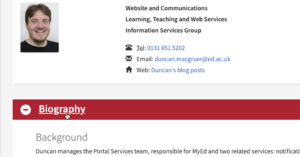
Duncan MacGruer profile page
On our profile pages, sections are placed under expandable feature boxes so that users can scan a long page without splitting up the information into multiple pages.
When we introduced this feature, we added additional tagging to our site to track interactions with these boxes. Event data is sent to our analytics account so that on our profile pages (and wherever these boxes are added in EdWeb), we can understand how our visitors use these interactive items.
The same applies for outbound links, document downloads and clicks on email addresses: all are tagged so that we can understand how they are used. None of that comes as standard in our version of Google Analytics.
You should consider which in-page interactions you need to measure before you launch your site (or feature). Doing this in advance lets you consider the structure of your event reporting, so that the results are comprehensible and can be broken down into appropriate categories.
Vertical leap blog post on event tracking
Measurement beyond Google Analytics
There are also some interactions that are very difficult to measure or understand through Google Analytics.
If we want to look at our site’s interface or design, then it’s often much more impactful to understand that through alternative visualisations. Heatmapping tools, scroll depth charts, scatter plots – and more – can help us understand how visitors interact with, for examples, navigation elements or how much content is visible to our visitors.
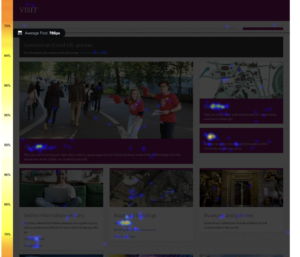
We use a tool called Crazy Egg to conduct such studies. University of Edinburgh site owners can use our account free of charge.
Requesting a Crazy Egg report (University login required)
Installing analytics through Google Tag Manager
Adding additional tagging is made so much easier for us because our site uses Google Tag Manager.
Tag Management is essential to how we provide measurement on our site, and remain responsive to changing needs from our content and marketing colleagues. It’s very simple to use (no coding knowledge is required), provides great flexibility to how tags and scripts are provided, and is central to adhering to our legal cookie and privacy obligations.
Webinar on our Google Tag Manager installation (University login required)