The new EdWeb2 update has successfully implemented Sustainable Web Design principles across 65,539 webpages
We’re estimated to save 25 tonnes of CO2 annually because of better web design choices. And that’s just the start…
What’s changed?
The new EdWeb2 update has made our sites greener!
We’ve made two key changes to reduce the page weight of our websites. Simply put, this means the file size of our web pages are smaller, meaning less energy is needed to store, load and transfer them. This may seem like a small change, but it has a big impact when the web pages are transferred thousands of times a day!
- Image upload size has been limited to 1MB: This has been implemented to reduce any outliers and huge image files that are energy intensive.
- All images have automatically been converted to the WebP format: WebP are around 25% to 34% smaller than JPEGs, and therefore are a quick win for making your website more efficient.
A bit of background
After completing our summer internship last year, my fellow green web interns Chris, Catalina, and I developed a range of recommendations aimed at enhancing digital sustainability at the university. These ranged from: improving website navigation, using darker colours on web pages and storing websites using 100% renewable energy.
However, taking these recommendations, applying them and seeing real improvement was a much harder battle.
This was particularly true in our case, where many of our conclusions pointed towards ‘people problems’ that highlighted our unsustainable relationship with websites and digital technologies, rather than problems inherent with the technology itself.
But one key recommendation did stand out:
Media, or more specifically images, were estimated to be responsible for around 67% of the digital emissions across the web estate. From here, we looked at championing online image optimisation tools, like Optimizilla or ShortPixel (which I would definitely still recommend) to reduce image file sizes. But apart from a bit of awareness, we didn’t see much change in the numbers, purely because this manual work puts further responsibility onto very busy web publishers.
This really highlights the age-old question with sustainability – Who’s responsibility is it?
Taking responsibility through EdWeb2
EdWeb2 is our in-house web platform service that hosts a large proportion of the university’s core websites. The service itself aims to make life easy for web publishers, by taking responsibility for their websites hosting, accessibility, cost, technical support, domain name and security – so why not add sustainability to that list?
By making the improved changes to image use, data transfer on all EdWeb2 pages is automatically reduced – taking some responsibility away from the owner.
This graph gives a good depiction of how this update has improved a few of the pages on EdWeb2:
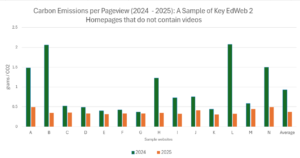
A chart showing the carbon emissions per pageview of key EdWeb2 homepages that do not contain videos, comparing data from 2024 and 2025
Page weight has become standardised – even the pages that were performing poorly last year have aligned with producing under 0.5 g of CO2/pageview!
This means that web publishers can use images more freely, as optimisation is predominantly taken care of within EdWeb2. Admittedly, this sample used in the graph contains only web pages with no videos as I was trying to highlight this standardised effect.
There’s definitely more work to be done around video use, as some pages with videos added saw emissions increases – but this is something we are looking into. However, all pages we looked at without videos saw emission reductions just like these pages above.
Trying to calculate the change
It can be particularly hard to find an accurate understanding of the change across 65,000 webpages – especially when carbon calculators like Ecograder crawl on a page-by-page basis.
The sample size of webpages that we have accurate data for from both before and after the image update is around 38 sites. This seems like a tiny proportion, and is, but it does represent 18.15% of the views share. This is because it includes the top 10 sites and other key website homepages – which receive a lot of traffic.
So, from our sample and calculations, CO2 emissions related to the whole of the EdWeb2 web estate is set to be lowered by about 25 tonnes annually.
This was a more conservative estimation in our calculations but still represents a total emissions decrease of over 50%.
I must stress that this estimation comes from limited data and is by no means a definite number.
But it does represent a real trend – carbon savings through better web design.
To put this in real terms
25 tonnes of CO2 is equal to
- 63,700 miles driven by an average gasoline-powered passenger vehicle
- 413 tree seedlings grown for 10 years
- £1,575 in the EU emission trading system
Going forward this summer
I can’t believe it’s already week 7 of this summer internship – there’s lots of work still left to do and the end is rapidly approaching.
We have been expanding our work with two new green interns, Otis and Zbigniew to further explore digital sustainability across the university. Zbigniew is working with the UX team as the digital design intern, looking to take case study examples from across the university and apply sustainable web design recommendations. Otis is working as the Green Platforms intern, working within the Digital Learning Applications and Media (DLAM) team to improve the digital sustainability of services like Learn and Media Hopper Create.
Look out for blogs from both of them!
Check for yourself
If you want to see how your web page (or any) performs in terms of sustainability use the online tool Ecograder or Website Carbon Calculator.
And as always, if you have any questions regarding web sustainability or about any of the calculations in this blog – feel free to drop me a message at odoherty@ed.ac.uk.