
Tables: when to use them and how to make them more accessible
Content Improvement Club is our regular meetup for web publishers. This month we ran the session in-person at Edinburgh Futures Institute. We focused on when to use tables, potential alternative layout options and how to make tables more accessible – if you do need to use them.
Do you really need a table?
Tables can be useful for displaying data or statistics that you might typically find in a spreadsheet and which are easy to organise in a structured way. However, often, tables are used to achieve a desired page layout or for decorative pages – this should be avoided as tables can make pages less accessible and cause display issues.
Before adding a table, it can be helpful to consider:
The size of the content
The usability of a table often depends on the amount of information it contains. Therefore, when thinking about whether to use a table consider the type and size of the content.
If you only have a very small amount of information arguably a table might not be needed. GOV.UK advise: “The minimum size for a table should be 2 columns and 3 rows (including a column header), but if your table is this small it may be better as normal text.”
Conversely, large amounts of long-form text often won’t display well in a table, especially on mobile. If in doubt, check how the table looks on different screens before publishing.
Check how tables display on different screens
Tables display differently depending on the device or screen being used, so it is useful to check how the page displays on a mobile device as well as desktop, for example. Tables often cause display issues for mobile users, making information hard to read. Long-form text entries are especially problematic as the text can wrap onto multiple lines, elongating the page and altering the page layout.
The example below demonstrates the difference in how the same table is displayed on a desktop compared to a mobile.
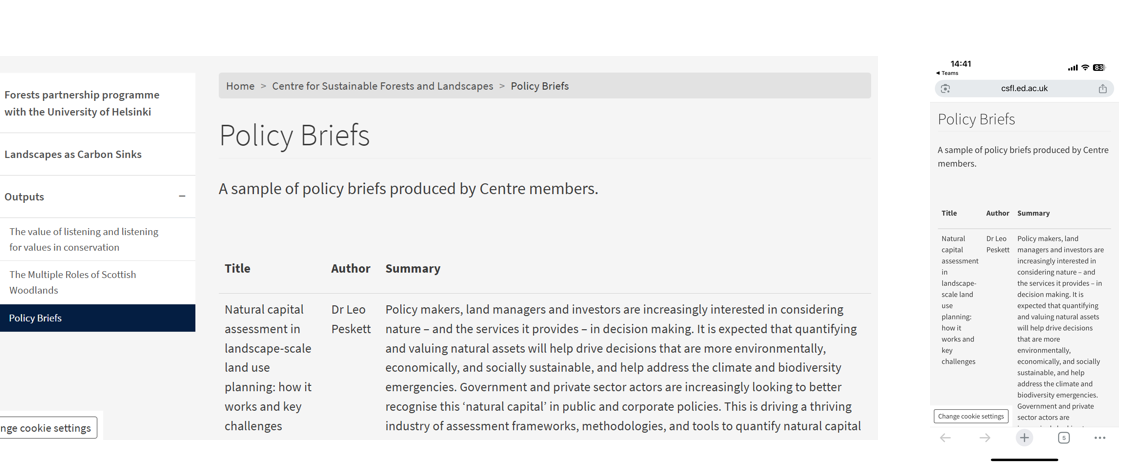
A screenshot showing the desktop view and mobile view of the same web page.
Alternative ways to present the information
There are often alternative layout options that are worth considering, such as grouping the information using:
- headings – this can help to break up the text and applying different heading levels creates a cohesive structure.
- bullet point or numbered lists – this can help to make the text easier to read and scan.
The Learn VLE SharePoint has a useful example of how a table used to display staff contact details, could be reformatted as text:
Tables | Learn VLE SharePoint (University login required)
If you do need a table, do what you can to make it accessible
It’s important to add the correct headings to a table so that screen readers can better understand the table’s structure. (A screen reader is an assistive technology, primarily used by people with vision impairments. It converts text, buttons, images and other screen elements into speech or braille.)
The below image shows the different headers within a typical table.
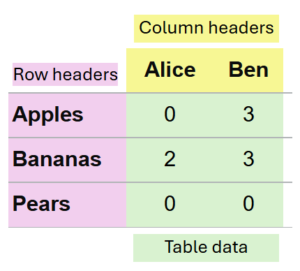
The anatomy of a table
To make your table accessible, its important to ensure that you have applied both column headers and row headers, describing accurately the content of each column or row.
GOV.UK also advise that you should use:
- only one header row
- only one item per row cell
- unique header titles, avoiding repetition of the same header title within the table
- ‘no data’ or ‘not applicable’ instead of empty cells (other than the top left cell if you have a header row that does not need a column header)
GOV.UK have a helpful guidance page on using tables where you can read more, including an insightful video which shows how screen readers use headers to make table content accessible.
Content design: planning, writing and managing content – Tables (GOV.UK)
How to check if a table is using headers
There’s an easy way to check if a table has headers applied, using the ‘Inspect’ tool using a Chrome browser:
- Right-click on the page and select ‘Inspect’
- Use the ‘select an element’ tool, then hover over table cells.
- th = table header
- td = table data
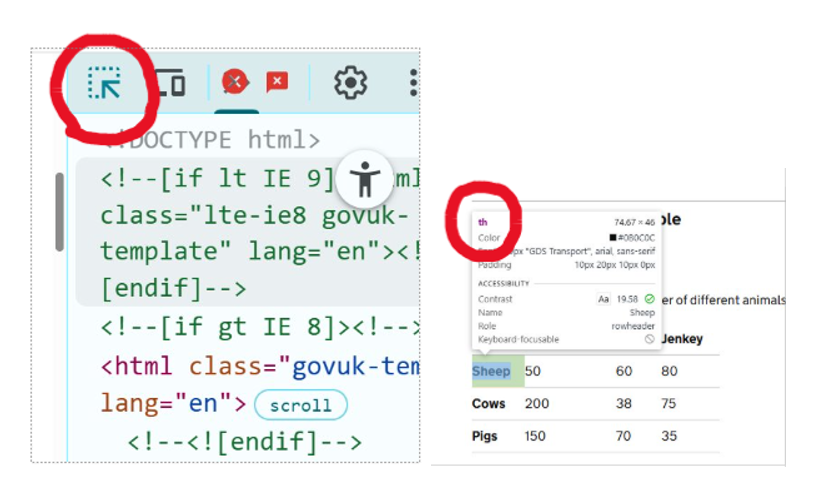
Screenshots to show how ‘Inspect’ tool within a Goggle Chrome browser works to identify if headers are being used on tables.
Useful further information about tables
- Content design: planning, writing and managing content – Tables (GOV.UK)
- Using tables – Imperial College London
- Tables – University of Edinburgh Learn VLE SharePoint (University login required)
- Tables guidance – EdWeb2 Hub (University login required)
- Tables Tutorial – Web Accessibility Initiative (WAI)
How to hear about our next session
We’ll promote our next session via our mailing list. If you’re interested, please sign up:
Join the UX and Content Design mailing list (University login required)
Other training that we offer
More training is listed on the User Experience website:
Training | User Experience Service