Any views expressed within media held on this service are those of the contributors, should not be taken as approved or endorsed by the University, and do not necessarily reflect the views of the University in respect of any particular issue.
Digimap is an online map and data delivery service, available by subscription to UK Higher and Further Education establishments. Operated by EDINA at the University of Edinburgh, Digimap offers a number of data collections, including Ordnance Survey, historical, geological, aerial photography, LiDAR, marine maps, land cover mapping, global mapping and census data. For more information about Digimap go to our website: https://digimap.edina.ac.uk Background image Contains OS data (c) Crown Copyright and database right 2022
We have had another very busy month and so a new batch of improvements for the Digimap services will be coming soon.
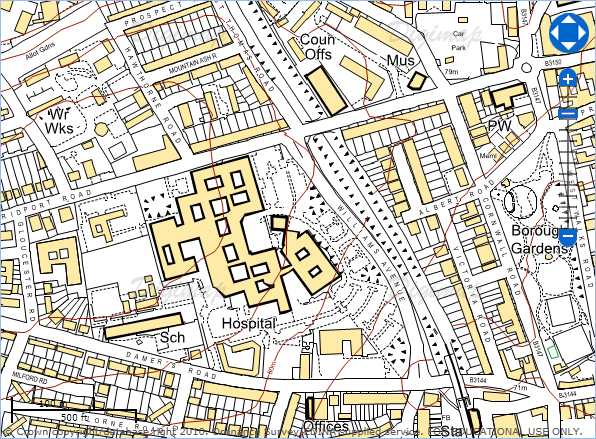
Printing in Ancient Roam
At the moment downloading data or saving screen images are the only ways to use the maps available in Historic Digimap once you have logged out. Soon you will be able to create and save high quality PDF maps from Ancient Roam for use offline. We hope you will find this a much better way to get the best quality mapping out of the service.
A sample image of what a PDF from Ancient Roam may look like.
New Data in Digimap Roam
Since the arrival of the Ordnance Survey’s latest large scale product, VectorMap Local, we have been busy thinking of the best way to include it in the Digimap Roam. We have decided to use it to create four new representations available at two different scale levels.
Here is a quick look at what the four different representations might look like:
Vectormap Local- StandardVectormap Local - StreetviewVectormap Local - PlanVectormap Local - 1:10,000 Raster
We haven’t stopped there either; we are also going to add in Line Drawing style mapping to the two most zoomed in levels; for those who like their MasterMap plain and simple, similar to planning application maps.
MasterMap - Line Drawing
You will be able to select the different views from the Map Content Control Tab using a drop down list.
For more information about VectorMap Local look in the Digimap help pages as it is already available for download:
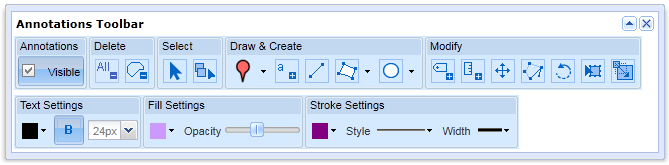
For those of you who have tried the annotation tools in Digimap Roam it will come as no surprise that we are very pleased to announce that we are now working on adding the same functionality in Geology Roam. Again the annotation tools are a first draft and will have exactly the same functionality as Digimap Roam’s tools.
Once they are released we’d really like to hear from you about which functions you use and what else you would like added. We are already hoping to add in some Geology Mapping symbols for you to add to the maps.
As an added bonus we are also putting in the measurement tools so you can measure areas and distances too, so you can tell how long a fault is or what area is covered by different rock types.
We have been having a play around with the new annotation tools in Digimap Roam here at EDINA, and have come up with a few things you might like to try.
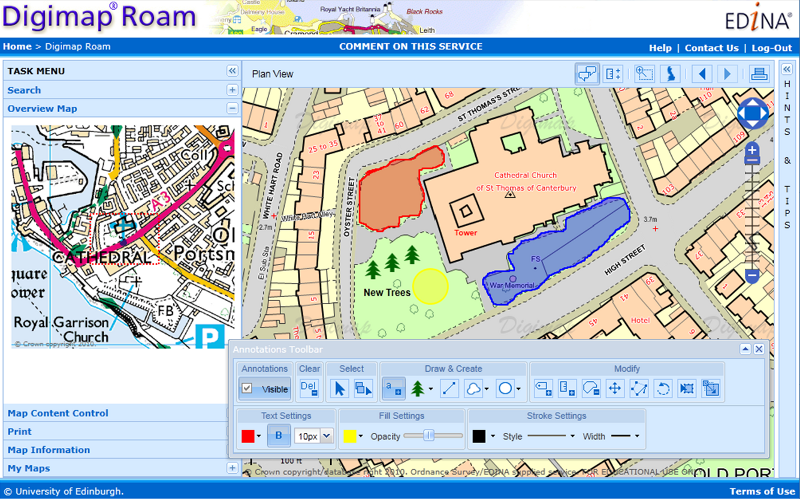
Firstly, you will have no doubt been adding many new features to maps but have you tried taking some away?
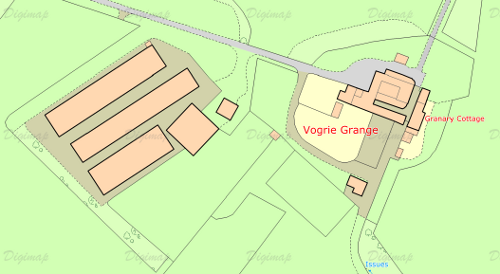
This is the original map area, a MasterMap map showing some large farm buildings to the left of the original farm house. If you had some information about how the area looked prior to their construction you could recreate a map form the past.
The map on the right shows the area after a large green polygon has been drawn over the building area. Make sure you select an appropriate line width and style for the map, and remember to set the opacity to maximum. You needn’t stop there though, you could add buildings on top of the green polygon representing those that had existed previously.
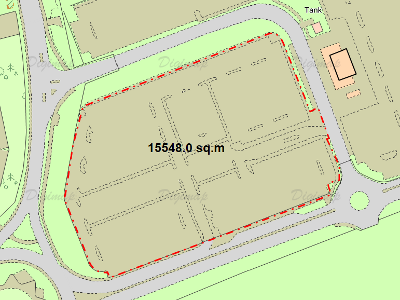
You can also use the annotation tools for some other neat tricks. The image below shows how you can trace around existing features, a car park in this case, and use the measurement tool to work out its area. By making the polygon fully transparent you can then print out your result without obscuring the original features.
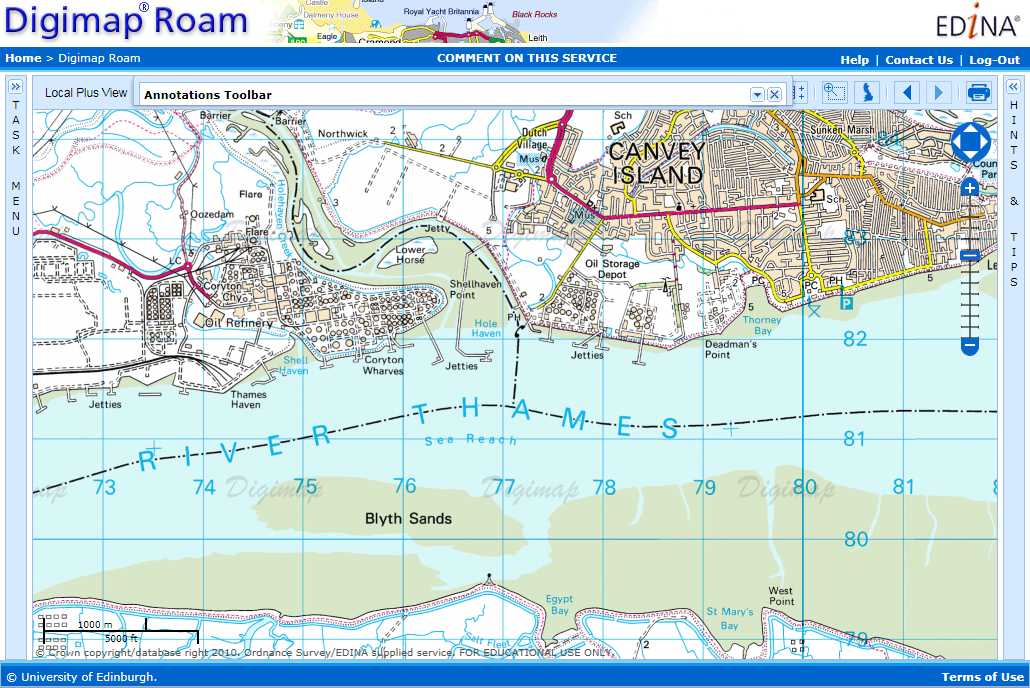
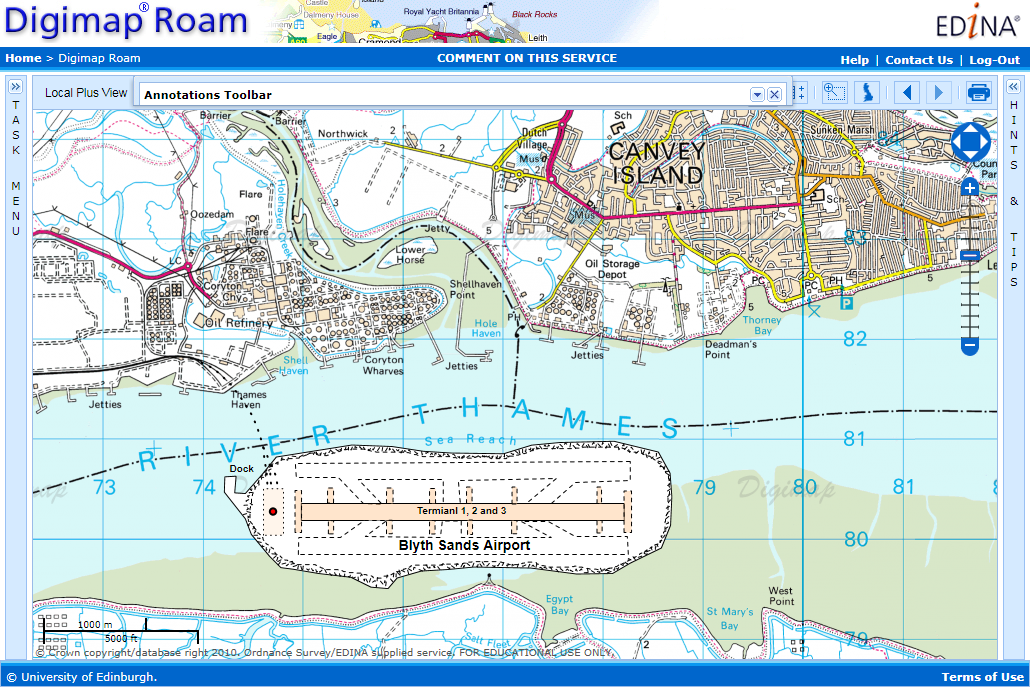
Finally you can use multiple lines and polygons, annotated with text to build up complex new features on the map. The example below shows a proposed new airport in the Thames Estuary:
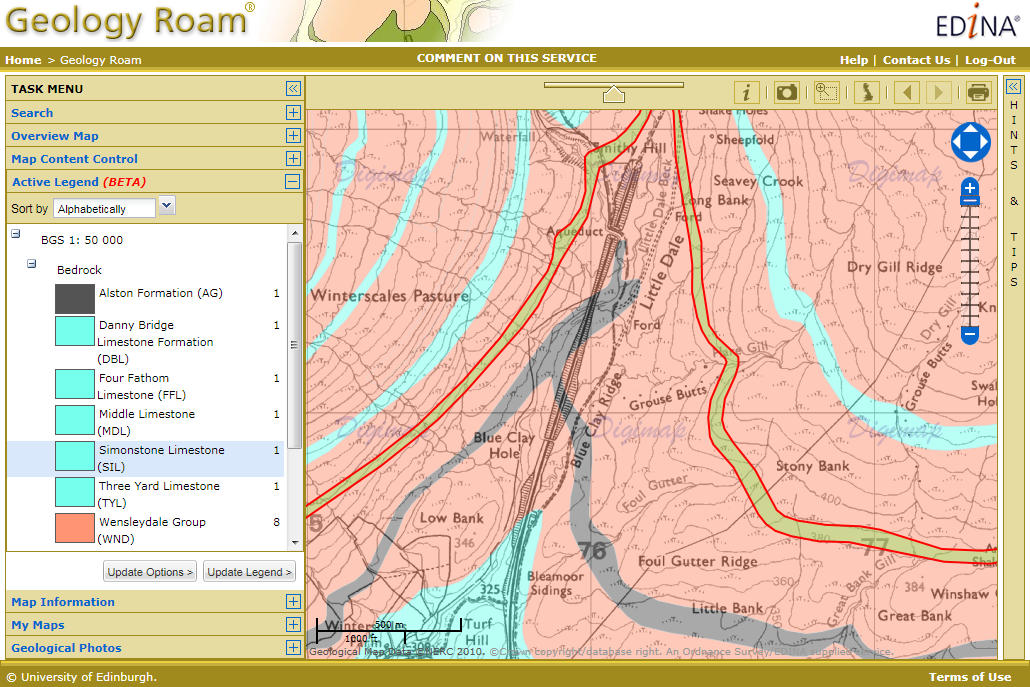
We have been working on a few improvements to Geology Roam and have now added rock labels to print maps and a new beta active legend.
Print Labels
The print labels show the lexicon code for each of the rocks on the map, therefore allowing you to identify them on a paper map and distinguish rocks with similar colours. The codes are placed in the centre of the area of each rock, if the rock area lies at the edge of the map then they are place in the centre of the area shown.
The labels are added by checking the box on the Print Map page. Below is a sample of what the maps look like, click on the thumbnail to view a full size image:
There is more information about the map labels in the printing section of the Geology roam help:
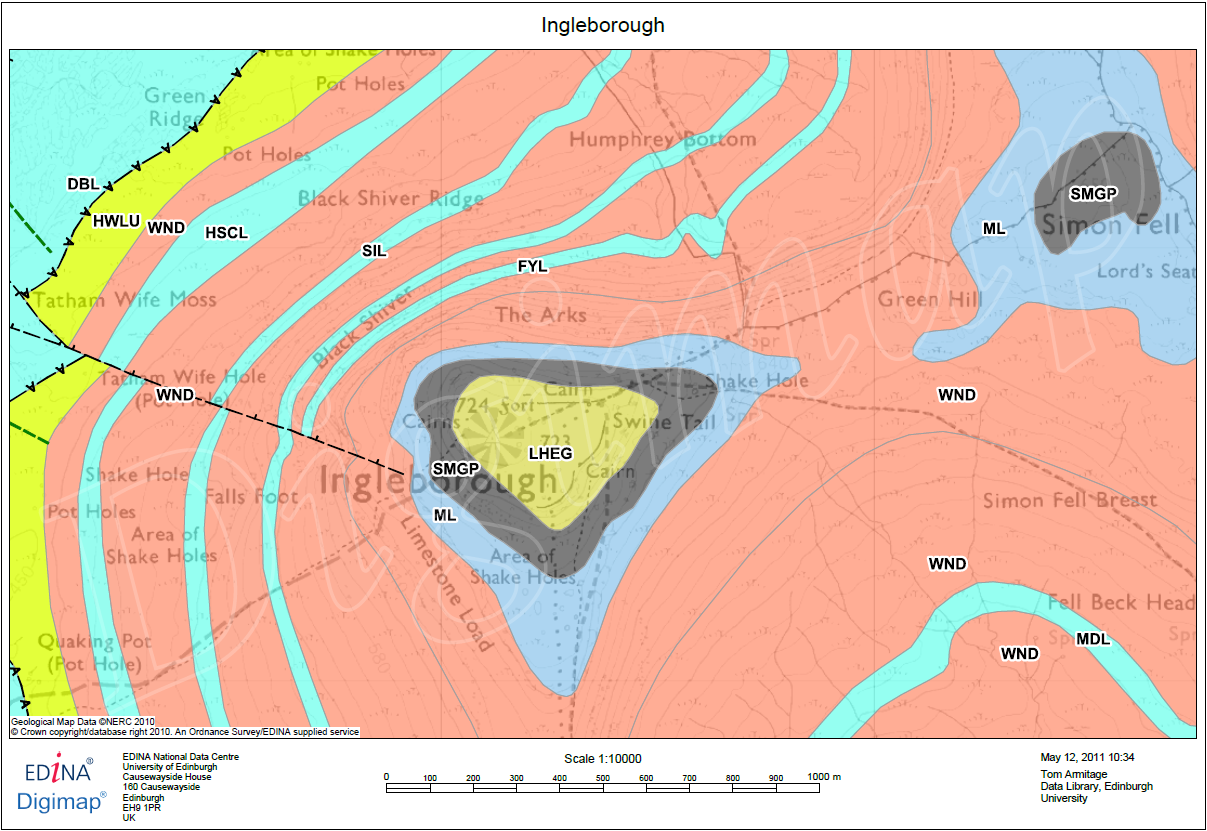
The active legend allows you to reorder the entries in the legend alphabetically or by the number units of that rock type. You can also click on the map to highlight rocks which will then be identified in the legend, this process works in reverse too, highlight rock on the map that have been selected in the legend. This functionality is still a beta version and we hope to extend the range of options available in the future. The image below shows the active legend at work, click on the thumbnail to view the full size image.
Instructions on how to use the Active legend can be found in the Geology Digimap Help pages:
These annotation tools are a first phase, to see what you find the most useful. We would like to hear from you about any changes or additions you would like making to the tools. Please send feedback to our help desk:
Digimap will be ‘at risk’ between 17:30 and 18:30 on May 17th to allow for some service changes and improvements to be made. Access to the service will have to be disrupted intermittently during this period as we add in some new features and make some software upgrades. We apologise for any inconvenience caused and hope that you find the new additions useful.
Along with new features being added on the 17th of May all print requests from Digimap Roam and Geology Roam will have to be made using the print button at the top right of the map. We will be removing the print tab from the list on the left of the map on June the 21st, but until then it will carry instructions on where to find the print button.
We are removing the tab to make room for the new features we are planning to add into the list on the left in the future. You may have noticed that it is already getting a little crowded in Geology Roam, with Geology Photos and an Overview Map being added since the service was launched, and there are more additions on the way.
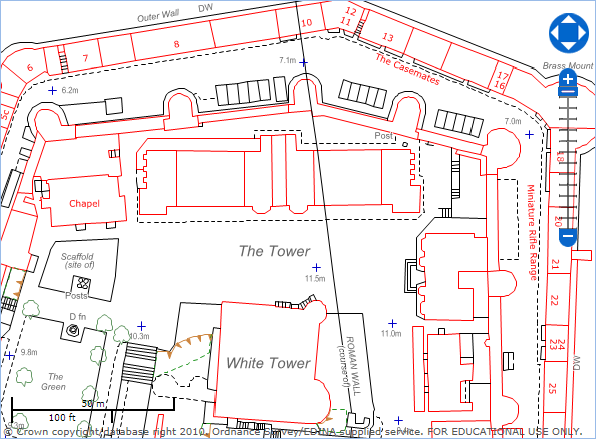
EDINA has been busy over these last few months creating some significant new features for Digimap Roam. To go along with the measurement tools we added at the beginning of April we are now working on some annotation tools.
These tools will allow you to draw symbols, lines and polygons on the map; add text, labels and area values; and set the colour and style of the features you have added. The features you add remain the same geographical size when zooming in and out and you can include them on your PDF print maps.
Final version may differ from the image shown above.
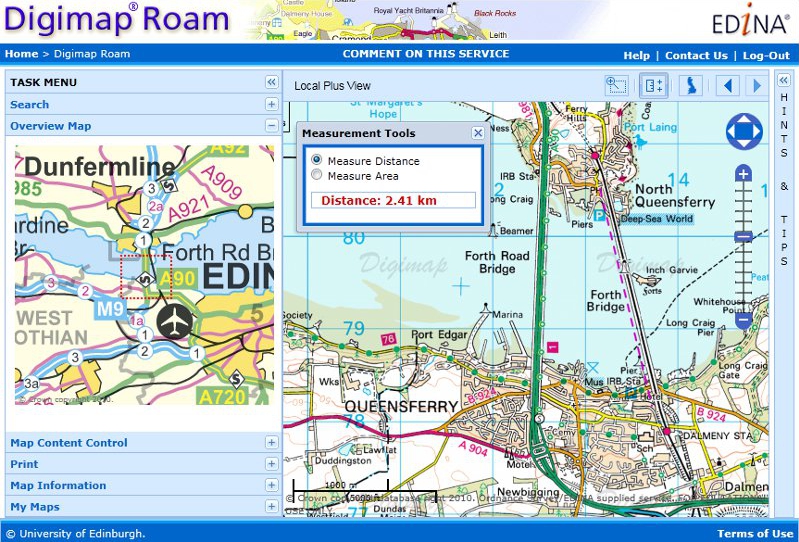
Digimap Roam has new measurement tools that allow you to easily check the distance between two or more points and find out the area of a polygon you draw on the map.
Click on the icon above the map to activate the tools. Select Distance or Area then start clicking on the map to define your line or polygon; use a double click to finish.
The new measurement tools in Digimap Roam
New Local Plus View:
Digimap Roam has also got a new zoom level to go with the measurement tools, bringing the total to 13. The view, called Local Plus, is a more zoomed out view of the 1:50,000 colour raster maps found in the Local view. The image above uses this new view as well as the measurement tools.
The Local Plus view prints at 1:40,000 compared to 1:20,000 for the Local view.
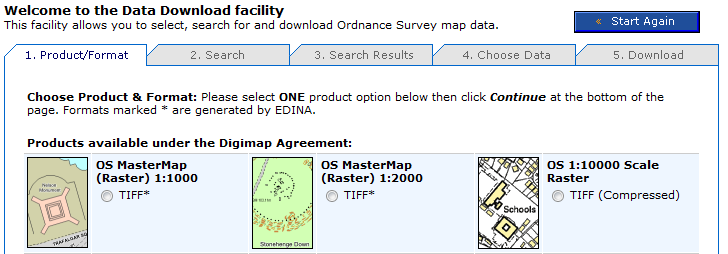
OS MasterMap data is now available to download in a rasterised (image) format from Digimap’s Data Download facility. If you need an image of OS MasterMap data (for example, as a backdrop map) but don’t need the complexity of the original vector data, this new stuff is for you.
OS MasterMap – detailed but complex
OS MasterMap is the most detailed product offered by Ordnance Survey. Maps made with with OS MasterMap have been available through Digimap’s mapping facilities since 2007, but if you wanted to use OS MasterMap as background for a customised map by overlaying your own data in a GIS you needed to download and convert the raw GML data. If all you want is a detailed colour background image, this seems like a significant investment of time.
Rasterised OS MasterMap – images not data
Digimap now offers OS MasterMap as .tif images at two scales: 1:1000 and 1:2000 through the usual Data Download facility. This saves you having to download, convert and import the data using specialist GIS software.
Where do I get the OS MasterMap raster background maps?
Log in to Digimap’s OS Collection, go to Data Download and select which scale of OS MasterMap image you want from the list of products. The images are tiled in 1km square tiles, so you can select your area of interest, and the tiles covering it, in the same way as other tiled datasets.
The scales are determined according to the distance on the ground represented by each pixel. The larger scale images are based on a measurement of 0.3125m per pixel. The smaller scale images are based on a measurement of 0.625m per pixel. These equate to approximate scales of 1:1000 and 1:2000 respectively, although these are dependent on the screen resolution of your monitor. You can easily display the maps at other scales, but some loss of image quality may occur if you do.
We have created some “How To” video clips and put them on YouTube for everyone to view. They show how to carry out various tasks with Digimap’s online maps and downloaded data.
If there are any particular aspects of the service for which you would like us to make a video, you can add them to the discussion on our Facebook page or email us directly at edina@ed.ac.uk.
On Tuesday 1st March, EDINA will be updating the metadata for the historical maps in Historic Digimap. The metadata changes will affect only the Scottish County Series maps and will mean that some maps will appear to “move decade”. More details of the implications of these changes are given below.
Accuracy of publication dates
When the maps were originally scanned, the detailed marginalia on the original paper map sheets was not captured at the same time. The marginalia contained information such as the survey year, publication year, re-publication year (if applicable) and surveyor name. During the digitisation process only one year from the marginalia was recorded; it is assumed this was the publication year but there was always some uncertainty around this.
A joint project between EDINA and the National Library of Scotland (NLS) was undertaken to digitise the marginalia of the original paper copies of the historical maps held by NLS. The metadata captured included the Survey Year and Publication Year. Until now, the survey year of all maps in Historic Digimap was unknown. We now have the survey year for a significant number (but not all) of the County Series maps for Scotland at both 1:2500 and 1:10 560 scales.
The significance of this project to Historic Digimap is that we can now use the more accurate and reliable publication dates for many of the County Series maps to improve the mapping and download facilities offered. In order to make use of the new NLS publication dates, these were matched with the original metadata using a series of rigorous database queries and manual processing.
How many maps have changed?
Consequently, around 35,000 County Series map tiles* (18%) now have survey years. Of these, around 28,000 tiles also have a more accurate publication date. In the majority of cases (over 70%) the publication date has only changed by a year or two. For nearly 2,000 tiles the change in publication date is more than 10 years, with the largest single change being 39 years. For those tiles which have not had updates to the survey year, the Landmark publication year used remains unchanged.
So what does this mean for Ancient Roam and Historic Download?
Nothing has changed in Historic Download in terms of how historical maps can be found and downloaded, but the updated publication dates will be reflected in dates provided on the order summary page in the downloader. These will be more accurate and reliable than previously.
For Ancient Roam, there are some more significant effects. The publication date is used to determine which maps are visible in each decade given in the timeline along the top of the map screen.
Many of the maps for which the publication date has changed by one or two years will remain within the same decade and therefore will not be affected. However, for some maps a change of a year or two in the publication date may be enough to shift the map from one decade to another. For example, a map previously thought to have been published in 1889 but now known to have been published in 1901, originally appeared in the 1890s decade but now appears in the 1900s decade.
Where there have been more significant changes in the publication date some have resulted in entirely new decades being available in the timeline for particular areas. For example, in Forfarshire there were two County Series editions in the 1890s. This was because maps originally published in the 1860s and 1870s were re-published in the 1890s. So where no maps appeared for Forfarshire in 1860/70s, they do now!
Other maps with significant publication date changes tend to be odd outlying tiles that for some reason had a significantly different date from neighbouring tiles. This means that some odd ‘holes’ have been filled.
How do I find out the map date source?
In addition to the new survey and publication data information, the Map Details information box will also be updated. A new icon has been added to the tool bar to access the map information and the information box styling has been updated in keeping with the other Digimap Roam clients. Three new attributes have been added to the Map Details information: Year Surveyed (where applicable), Sheet Title (where applicable) and Date Source. The Date Source information will tell you whether the publication year came from the original Landmark data or the NLS metadata.
While these changes to Scottish County Series maps means that the per decade classification is now different, the changes mean that the dates are now more accurate. Our thanks go to the National Library of Scotland for their hard work on this project.
The updates to Historic Digimap will take effect on the evening of 1 March 2011.
*Map tiles refers to the ‘cookie-cut’ National Grid versions of the maps, not the original County Sheets