Service Availability 26 – 28th Jan – new registration system release

We are introducing a new registration system in January (26th to the 28th) and would like to give advance warning of the service disruption this is will cause.

  • New users will not be able to register for Digimap from 4pm on 26th January
  • All Digimap services will be unavailable all day on 27th January
  • Normal service will resume on 28th January

New registrations for Digimap, using the current system, will be closed from 4pm Monday 26th January to ensure that no registrations are lost during the changeover. All Digimap services will then be unavailable all day on Tuesday 27th January, while we put the new system in place. Once all the work is complete the service will be available again hopefully by midday on Wednesday 28th January.

We apologise for the inconvenience caused but due to the significant changes required to release the new system we must close access to Digimap during this time. We urge you to create any maps or download data that you may need during the period of service unavailability in advance.

The new registration system will allow users to register and instantly access Digimap Collections via email verification speeding up access for new users significantly. We hope that this will help make up for the fact that new users will be prevented from registering during the maintenance. Existing registered and active users will not notice any change once normal service has been resumed.

If you have any questions or concerns please contact us:

  • Email: edina@ed.ac.uk
  • Phone: 0131 650 3302

More details about how the new system looks and works will be posted on the Digimap blog in the New Year.

Visualising OS MasterMap® Topography Layer Building Height Attribute in AutoCAD Map 3D and InfraWorks

Update 12/02/2015: The contents of this blog post have been moved to the Digimap Help system and can be found at the following location (link opens in a new window):

http://digimap.edina.ac.uk/webhelp/digimapgis/index.htm#autocad/building_height_attribute/bha_in_autodesk.htm

For an overview of Building Height Attribute please see the following page (link opens in a new window):

http://digimap.edina.ac.uk/webhelp/digimapgis/index.htm#bha/bha.htm

InfraWorks visualisation
OS MasterMap® 1:2,000 Raster draped on top of OS Terrain™ 50, with buildings from OS MasterMap® Topography Layer extruded on top using Building Height Attribute data.

Visualising OS MasterMap® Topography Layer Building Height Attribute in QGIS

Update 12/02/2015: The contents of this blog post have been moved to the Digimap Help system and can be found at the following location (link opens in a new window):

http://digimap.edina.ac.uk/webhelp/digimapgis/index.htm#qgis/building_height_attribute/bha_in_qgis.htm

For an overview of Building Height Attribute please see the following page (link opens in a new window):

http://digimap.edina.ac.uk/webhelp/digimapgis/index.htm#bha/bha.htm

QGIS 3D visualisation with trees
OS VectorMap® Local Raster draped on top of OS Terrain™ 50, with buildings from OS MasterMap® Topography Layer Building Height Attribute and Positioned Non Coniferous Trees extruded on top


OS MasterMap® now available in File Geodatabase format from Digimap

To get the most from OS MasterMap data it is usually best to convert it from its supplied format, GML, to a format better suited to the software you are going to use it in. For our CAD users Digimap has been offering the DWG format for several months (see previous blog post); now we are offering a format that makes the data easier to use in GIS software.

Although Shapefile is still the most commonly requested GIS format it cannot handle the large file sizes (over 2GB) that could be requested from the Data Download service; an area of 100km2 in an urban centre would exceed this limit.  We therefore turned to the File Geodatabase format that works in the two most commonly used GIS software applications, ArcGIS and QGIS. There is more information about Geodatabases on Wikipedia here: Wikipedia -ArcGIS Geodatabase

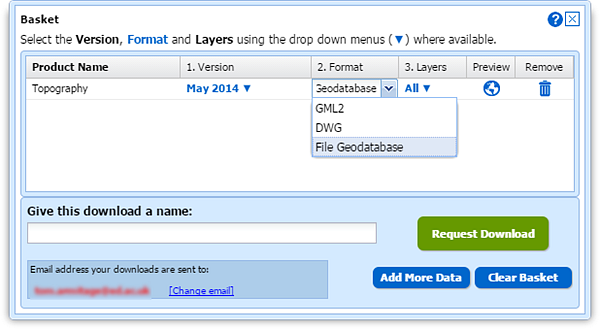
To select the File Geodatabase format, add some MasterMap to your basket in Data Download. Once in the basket you can click the down arrow in the Format column and change it from the default GML to File Geodatabase:

File Geodatabase in Data Dowload

Geodatabase formats are the recommended formats  for use in ArcGIS software, being the most efficient for data storage and analysis. The format supports the use of .lyr files for styling the data and EDINA has provided some for the MasterMap data downloaded from Digimap.

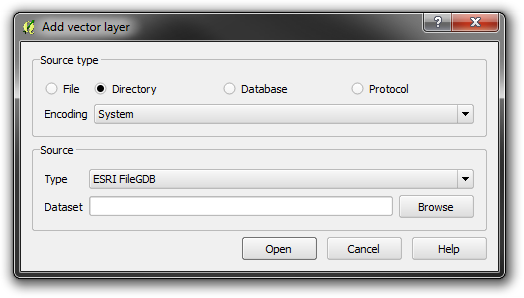
The data can be added to a map in ArcGIS and QGIS in the usual way, though in QGIS you need to use Add vector layer –> Directory rather than a Database as you may assume.

Opening a Digimap File Geodatabase in QGIS

Styling information for both ArcGIS and QGIS has been provided by EDINA in .lyr and QML formats, these can be found at the bottom of Digimap’s help page for OS MasterMap. These representations give enough information to view the data in a style that OS MasterMap is commonly viewed in. The help page also contains a link to the official Ordnance Survey SLD styling information, please see the PDF that comes with the SLD files for information on how to use them.

There are help pages for adding styling information here:

If you require any help on using File Geodatabases from Digimap or any other dataset or format then please get in touch:

  • Phone: 0131 650 3302
  • Email: edina@ed.ac.uk

Visualising OS MasterMap® Topography Layer Building Height Attribute in ArcGIS and ArcGlobe

Update 12/02/2015: The contents of this blog post have been moved to the Digimap Help system and can be found at the following location (link opens in a new window):

http://digimap.edina.ac.uk/webhelp/digimapgis/index.htm#arcgis/building_height_attribute/bha_in_esri.htm

For an overview of Building Height Attribute please see the following page (link opens in a new window):

http://digimap.edina.ac.uk/webhelp/digimapgis/index.htm#bha/bha.htm

BHA data in ArcGlobe

Digimap Download Basket Updates

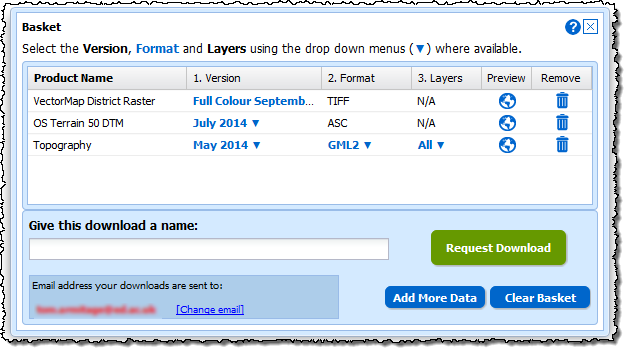
We have updated all the new style Download interfaces in Digimap to make it easier to change the options for the data you have selected. When you have added some data to your basket you can now see more clearly what can be changed; the version (date and style), the format and the layers.

New Download Basket

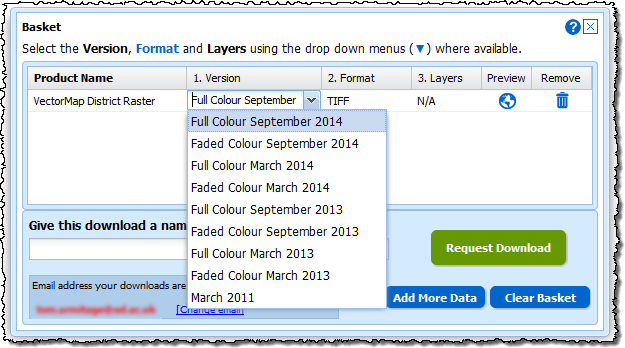
Where these options are highlighted in blue with a next to them you can click them and get a drop down menu with the alternatives.

New Download basket with open menu

Make the changes you need, add a name,  then click on the Request Download button to order your data.


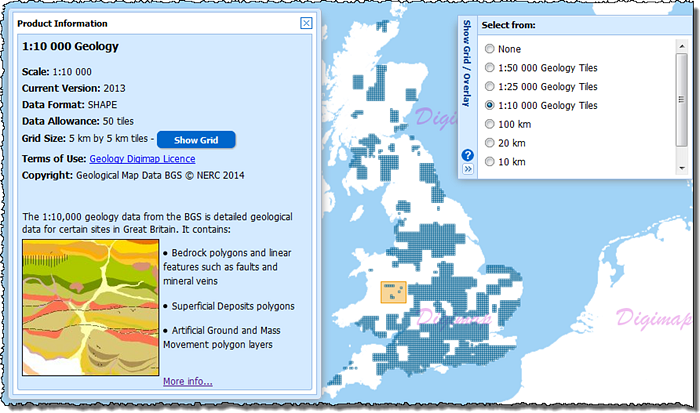
We have also made a slight change to the Product Information pages for some of the data products too.  Where the data is available on tiles you can now click a Show Grid button to see the tile outlines on the map.  When you make a selection on the map you will get all the grid tiles that are partially or entirely within your orange selection area.

How to View a Grid in Data Download

This feature is particularly useful for data products like the 1:10,000 and 1:25,000 scale geology data and the Marine HydroView Charts, where the data isn’t a continuous coverage and your selected area may contain no tiles. When you click the Show Grid button it will also automatically open the menu from the right of the map which allows you to change the grid shown or switch it off.

Remember, you open the Product Information panels by clicking on the blue Info links in the list of data products to the left of the map.

Please let us know if you have any questions about these changes or anything else:

  • Email: edina@ed.ac.uk
  • Phone: 0131 650 3302

Digimap Roam: Printing PDFs from Chrome

We are getting a few reports from users experiencing issues when printing PDF maps using Chrome web browser. Unfortunately, the map watermark and any semi-transparent annotations are being printed as solid filled features. We have discovered that this occurs when the PDF is viewed and printed from within the Chrome browser, using Chrome’s in built PDF plugin.

We have investigated this problem and discovered that the bug is with Chrome and occurs with all PDFs with semi-tranparent layers not just those created by Digimap. The problem only happens on Windows computers with versions of Chrome released since the end of April (Chrome 34.0.1847 onwards).

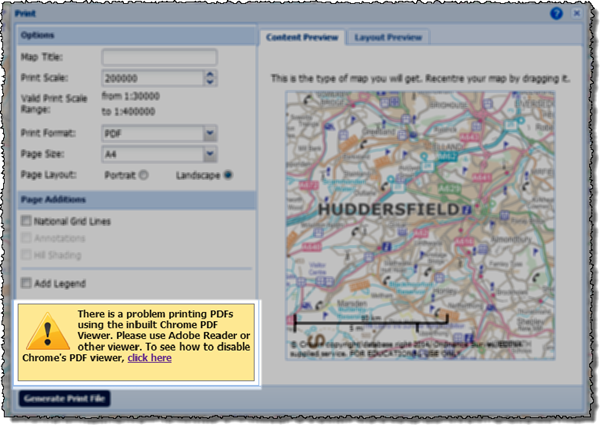
Digimap users with Chrome should see a warning when they open the Print… window, informing them about the problem.

Print interface showing chrome alert

As the alert message suggests you can disable the plug-in to prevent it from opening PDFs or you can use the following workaround.
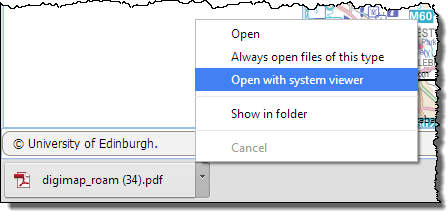
Printing from Chrome alternative method

  • Create your printable map as normal it will appear at the bottom of your web browser.
  • Don’t click the file name to open the PDF, click the little arrow and choose ‘Open with system viewer’.
  • Providing it is installed on your machine, the map will open in Adobe Reader which will print the semi transparent layers correctly.

We hope that the issue is resolved by Google who develop the Chrome browser, it has been reported to them. Should you wish to disable the plug-in entirely then you can follow the instructions with the image below. You can also download the map as a file to your computer, and then open it directly with Adobe Reader, this is usually the best option anyway as it allows you to print the PDF multiple times or store it if you don’t want to print it just yet.

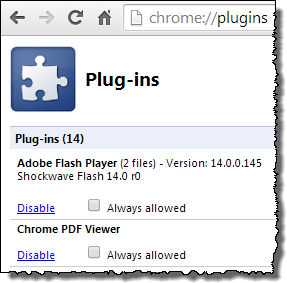
Disabling Chrome PDF plugin

  • Type Chrome://plugins into the web address bar in chrome, this opens a list of all the plug-ins you have installed for Chrome.
  • Scroll down to the Chrome PDF Viewer on the Plug-ins page and click on the blue “Disable” link.
  • You will no longer have the option to view PDFs in the web browser.
  • Use this page to reactivate the plug-in if you want to reverse the change in the future.


If you need any assistance with opening your PDF map, please contact the EDINA helpdesk:

  • Email: edina@ed.ac.uk
  • Phone: 0131 650 3302

Digimap: Internet Explorer 10 Issue

For those of you using Internet Explorer (IE) version 10, you may have noticed that the maps in Roam can get muddled up. This browser is standard for Windows 8 and is also available as an upgrade if you are using Windows 7.

Muddled maps in IE10

The error is caused by the underlying technology EDINA uses to put the maps into your web browser.  A patch for the particular piece of software that causes the issue has been released and we are now working to incorporate this into Roam.

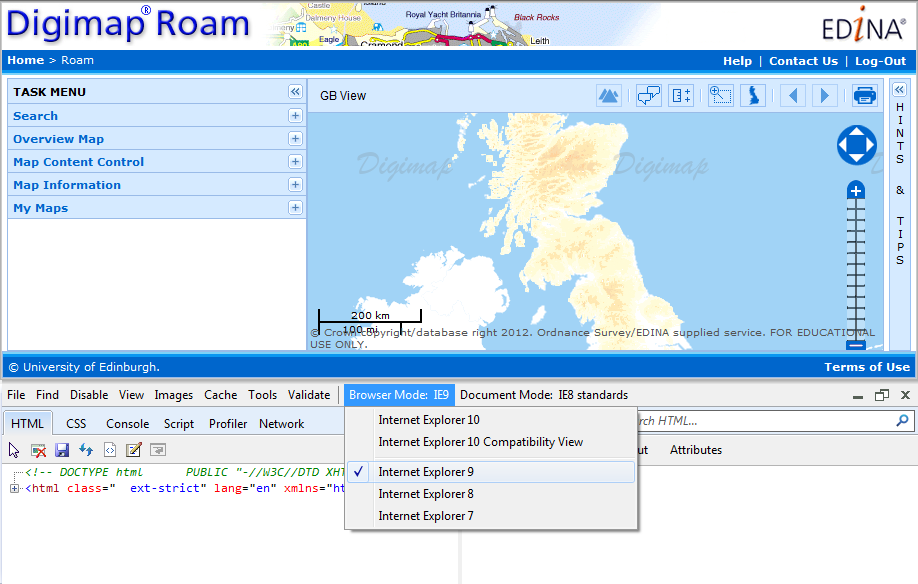
Until this fix has been released you can prevent the error from occurring by switching IE 10 to run in IE 9 mode. To do this simply press F12 on your keyboard when you are using IE 10 and change the Browser Mode: to Internet Explorer 9.  The image below shows how this is done:

Changing IE10 to IE9 Mode
Click the image to enlarge it.

This issue affects all the different Roam mappers, Digimap, Ancient, Geology and Marine, however all will be fixed by making the change to the browser mode.

If you have any questions about this or any other issue with the Digimap services then please get in touch:

  • Email: edina@ed.ac.uk
  • Tel: 0131 650 3302

New Digimap Case Studies

We have been busy over the last few months collating a new set of case studies showing how the different Digimap collections are being used. There are 13 new examples covering subjects as diverse as Archaeology, Religious History, Palaeontology and Geochemistry, as well as more traditional subjects like Landscape Architecture.

Green Infrastructure Study of Cheltenham and Gloucester: David Green Digimap Case Study
Green Infrastructure Study of Cheltenham and Gloucester: David Green

The new case studies can be found in the Digimap Support pages along with the previous examples we have collected over the years:

New Digimap Case Studies

If you would like us to feature your work as a Case Study then please get in touch with us: edina@ed.ac.uk. We are especially keen to hear from those using Marine Digimap.

Digimap and Anti-virus Software

Service "At Risk".Recently  we have discovered a handful of users have found maps failing to load in Digimap’s mapping applications. All other tools are available, just the map is missing.

This appears to be caused by anti-virus software installed on the users computer blocking the maps streamed from Digimap.  Adding Digimap to the list of trusted sites should resolve this problem, although the specific format of the URL to trust is important.  If maps are failing to load for you too, please check that Digimap is listed as one of your trusted sites. If Digimap is listed and the maps still fail to load, please contact us for assistance.  We will need to know the name and version of the anti-virus software you are using.

If your computer is centrally administered by your institution you may need to contact Computing Services for assistance to amend your list of trusted sites.