More Data Download Improvements

The new Data Download has been updated with a few more enhancements that will make it even easier to use; it is now no longer in BETA.

Data Download Improvements May 2012A selection of the improvements made include:

  • Changes to where you change between panning the map and drawing a rectangle to select to make it more obvious what you are doing.
  • A general improvement of the lay out and buttons used.
  • My Account has been moved to the top right of the screen.
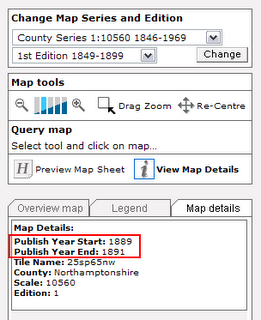
  • Better product information by clicking on the info icon.
  • You can clear the selection you have just made using the Data Download Clear Selection button.
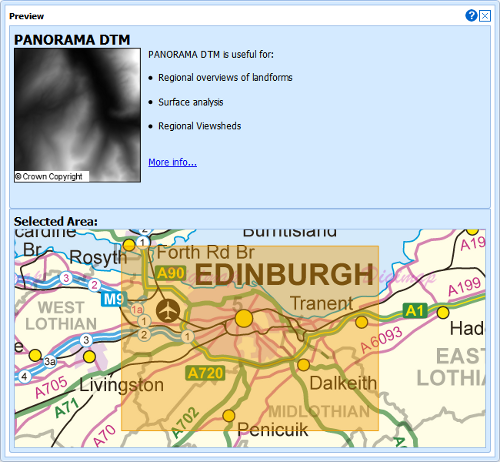
  • A greatly improved preview of the each dataset in basket, showing what the product is like, what it can be used for, and the extent of the area you are taking:

Data Preview Improvements May 2012These changes have been made in response to recommendations from a usability project run in conjunction with the redevelopment of the Data Download service. You can read more about this project, called USeD, on its blog here:

USeD Project Blog

The enhancements also include a fix to a bug that some users experienced when using the latest version of the Google Chrome web browser; the interface no longer offsets the area you select when displaying it on the map.

YouTube Videos Available to Edit and Reuse

YouTube IconAll our YouTube videos are now available under the Creative Commons licence. This means that you can copy, distribute and create derivative works from them if you give us credit. The videos are now available in the YouTube video editor so you can use them to help other users or show people what you have learned to do.

For information on what the Creative Commons licence means and how to edit the videos within YouTube go to this web page:

YouTube Instructions

We’d really like to hear from you if you have been using our videos; please send us an  email: edina@ed.ac.uk

If you have an idea for a video you’d like us to make you can join the discussion on our Facebook page: Facebook | YouTube Discussion

“How To” Videos on YouTube

You Tube IconWe have created some “How To” video clips and put them on YouTube for everyone to view. They show how to carry out various tasks with Digimap’s online maps and downloaded data.

You can see all the videos on the EDINA Digimap YouTube channel: http://www.youtube.com/user/EDINADigimap

If there are any particular aspects of the service for which you would like us to make a video, you can add them to the discussion on our Facebook page or email us directly at edina@ed.ac.uk.

Revamp of Digimap Help pages

We have implemented a new Help system for the Marine and Geology Digimap collections (Marine Help and Geology Help). The Help pages have been moved to a new production system which will make is easier for us to keep them more up to date and allow you to find the information you are looking for more easily and print better looking pages.

Visually there is not much change to the pages but over the coming months we will be updating and revising the content of the Help pages within Digimap to provide users with improved access to information about the Digimap facilities, the data available and how to use the data in different systems.

If you have any comments about the new Help pages or suggestions please let us know.

Tip: if you want to search for a phrase put it in quotes e.g. “zoom to position”

ArcGIS and raster catalogs

The following may be of interest to those Digimap users who have ArcGIS 9.3.1 and are using raster catalogs.

ESRI have just released a patch fixing the issue with Microsoft SQL Server and Raster Catalogues. This works with ArcGIS 9.3.1 Service Pack 1.

ESRI’s announcement is as follows:

“ESRI announces ArcSDE 9.3.1 SP1 SQL Server Raster Catalog and Raster Field Patch. This patch addresses the raster catalog display and raster field identify problem for SQL Server following the install of 9.3.1 sp1. We recommend that all who store raster catalogs or raster fields in ArcSDE for SQL Server download and install this Patch at their earliest convenience to ensure the highest quality experience when working with ArcSDE 9.3.1 Service Pack 1.”

Link to patch🙁http://support.esri.com/index.cfm?fa=downloads.patchesServicePacks.viewPatch&PID=17&MetaID=1586)

A further note on creating EPS files…

You can create EPS files directly from Adobe Acrobat by using an appropriate Printer Driver e.g. CutePDF or one downloaded from Adobe’s website. For example: http://www.adobe.com/support/downloads/detail.jsp?ftpID=1500 and follow the instructions at: http://www.ep.ph.bham.ac.uk/general/printing/winsetup.html

Note: you will need the Generic Colour Postscript PPD file linked in the document if you want to print A3 or larger. You can download the PDD file from the above website.

Load the PDF into Acrobat and then go to File ->Print. Select CutePDF Writer (or another Postscript printer you have installed). Click on Properties and then the Advanced… button.

There is a section called Postscript Options; expand this to find the PostScript Output Option and change this from ‘Optimize for Speed’ to ‘Encapsulated Postscript (EPS)’.

When you print you will now be asked to save a file which you should add the extension .eps to your file. You should be able to open this file in Ghostview as a vector EPS.

In lieu of EPS files…

Since Digimap ceased to generate EPS files we have had a number of enquiries about suitable alternatives. Currently, Digimap’s mapping facilities will only produce PDF files. However, there are a number of options for those who prefer to use other formats. The following notes may help.

Note that EDINA does not endorse or recommend any of the products or services detailed here or guarantee their quality or performance.

PDF files generated from Digimap can be converted to various other formats including PNG, SVG, and PS/EPS using free software called Inkscape (http://www.inkscape.org/). The only down side to this that we have found is that it seems to blur the PS/EPS because of the ‘Digimap’ watermark.

You can also edit the vectors in Inkscape. If you want to put the map (or a bit of it) into a Word document there is a nifty little command in Acrobat under Tools –> Select & Zoom–> Snapshot Tool which allows you to define an area and then paste it into Word (or another programme) – note this is lower resolution than you can create with Inkscape.

The PDFs themselves can be opened in CS3 Adobe Illustrator as editable vector graphics and then exported to various formats. The PDFs can also be opened and converted to EPS in GhostView but this seems to treat them as images rather than vectors.

There are various software packages that will convert from vector PDF to DXF (e.g. http://www.trixsystems.com/pdfFLY.html) but we have not found any which are free of charge.

If DXF/DWG is required for OS MasterMap, the best option is to download GML and use Dotted Eyes’ InterpOSe software to convert from GML to DXF/DWG.

FAQs about Change-only Update

Why does my Order say that CoU is not available?

Check the date on which you created the original Order. If you created it after the last set of CoU was released but before the next set of CoU is released, then you already have the latest version of the data. If a release of CoU is imminent, you should wait until after the release date, and then check your data order for the availability of CoU.


I have downloaded CoU for my area, but having applied it to my existing data holding, nothing looks different. Why is this?

Not every feature changes every time a Change-only Update is released. It may be that none of the features in your data holding have been updated this time. It is not possible for EDINA to determine exactly whose orders contain changed features.

You may also find that there are some small changes to the attributes for your data. These are harder to identify if you are simply looking for changes visible on a map. It isn’t necessarily the geometry or position of a feature which has changed. When you plot the changes on a map, you may not see them, because the changes may relate to data in the attribue table.


Why can’t I have CoU for other datasets?

Only OS MasterMap data offers Change-only Update. This is because other datasets are not structured in a way which enables CoU to be identified and extracted separately. Other datasets are also not updated so frequently.

GML data translation from Dotted Eyes

Dotted Eyes, a well established digital mapping solution provider, has produced an edition of their InterpOSe GML translator specifically for EDINA Digimap users.

The Digimap Edition of InterpOSe will translate OS MasterMap GML data from Digimap’s MasterMap Download facility and convert it to various file formats, including Shape, TAB, mid/mif and DWG/DXF. InterpOSe deals with both Topography and ITN layers, and is tailored specifically for data from Digimap.

InterpOSe (the Digimap Edition) is free for Digimap users upon registration with Dotted Eyes. Please visit their website for more information and to download a copy of InterpOSe:

http://www.dottedeyes.co.uk/spatial_data_loading/interpose/digimap.php

Publication dates for historic maps

Question: How do I find out what ‘Publish Year Start’ and ‘Publish Year End’ dates means for the maps in Historic Digimap?


Answer: The publishing date range of a map in the Map Details tab from the Main Map View in Historic Digimap. This is achieved by using the View Map Details tool (an i symbol) and clicking on the historic map at the point of interest.

The maps shown on the screen are created from the National Grid “cookie cut” files – images which have been rectified and clipped to create a national grid based “tiled” dataset akin to those available for the contemporary Ordnance Survey data. However, the National Grid does not match up with the County Series maps, because the County Series were created on a per County, rather than a national, basis. It is therefore likely that one “cookie cut” National Grid tile comprises parts of more than one County Series map sheet, each of which could have a different publishing date.

The metadata for the National Grid “cookie cuts” often does not contain one publishing date but the range (from, to) of publishing dates of the Orginal mapsheets which make up that national grid cookie cut tile. It is this range which is reported under the Map Details tab.

Unfortunately, EDINA does not have any survey dates for the maps in the Historic Digimap. Landmark Information Group who provided the maps did not capture the survey dates when the maps were digitised (scanned). This is because the maps were originally digitsed for a specific purpose which did not require the information held in the marginalia of each map sheet. During the digitisation process the marginalia was trimmed from the resultant files, meaning that it was never captured in digital form.

A solution to this is to visit a library which holds historic maps; many university libraries have historic map collections with specialised cartographers and support staff. The map details taken from Historic Digimap can be used to search for and locate the map(s) corresponding to your area of interest. Once found, it is in a map’s marginalia where you can find the recorded survey dates.

More detailed information about historic maps and Historic Digimap can be found in the Help pages.