Any views expressed within media held on this service are those of the contributors, should not be taken as approved or endorsed by the University, and do not necessarily reflect the views of the University in respect of any particular issue.
Digimap is an online map and data delivery service, available by subscription to UK Higher and Further Education establishments. Operated by EDINA at the University of Edinburgh, Digimap offers a number of data collections, including Ordnance Survey, historical, geological, aerial photography, LiDAR, marine maps, land cover mapping, global mapping and census data. For more information about Digimap go to our website: https://digimap.edina.ac.uk Background image Contains OS data (c) Crown Copyright and database right 2022
Join us for an exciting journey through time and space as Giles Martin, Head of Data Sales at Landmark, reveals the fascinating world of historic maps and the rich geospatial insights they offer — including the full range of resources available through Digimap — in our upcoming webinar.
Join us for an exciting journey through time and space as Giles Martin, Head of Data Sales at Landmark and Michael Sebhat, Head of GIS, unveils the captivating world of historic maps and the powerful geospatial insights they hold, including the comprehensive offerings from Digimap, in our upcoming webinar.
As mentioned at Geoforum earlier this year, we’re currently working hard on a new version of Digimap Roam. The new-look application will bring Digimap Roam, the online mapping tool in the Digimap family, bang up to date with the latest web technologies available. Whilst the functionality will remain the same, the look and feel of the interface will be more modern. The majority of functions will be available from a new menu panel down the left hand side which is hidden by default maximising the area available for the main map element. By utilising the latest technologies we will be able to add new functionality and make further enhancements to the application in the future.
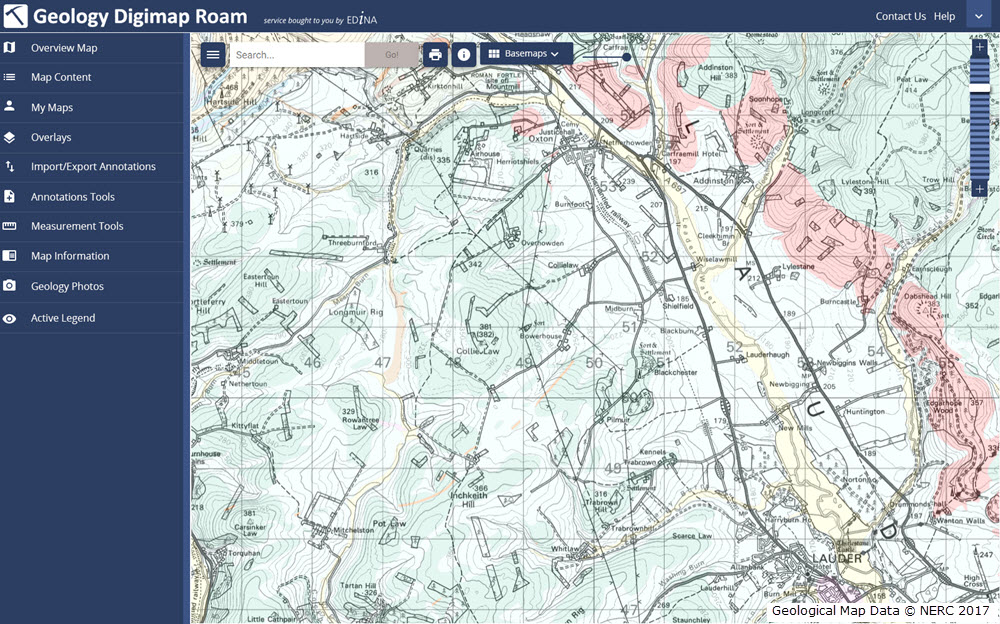
The new interface makes further improvements to the experience on mobile devices, an area where we’re seeing an increase in usage across the service. A mock up of how the new Geology Roam interface might look is included below to give you an idea of the proposed layout and styling:
Mockup of the new Geology Roam interface
Currently we are on target to launch the new interface early in the first semester of the 2017-2018 academic year, but we will post progress updates on this blog as the new interface approaches completion. There will be a phased release with the new Roam applications with the Ordnance Survey Collection being first in line.
We appreciate that you may have teaching or lecture materials that may require updating as a result of this change in interface, so we will run all the existing Roam applications alongside the new versions so you can get up to speed with the new interface whilst the existing versions are still available. At the moment we anticipate running both versions in each Collection side by side until at least the end of the year. During this period we would welcome any comments and feedback that you may have.
As ever, if you have any questions about the new Roam, please do not hesitate to contact us.
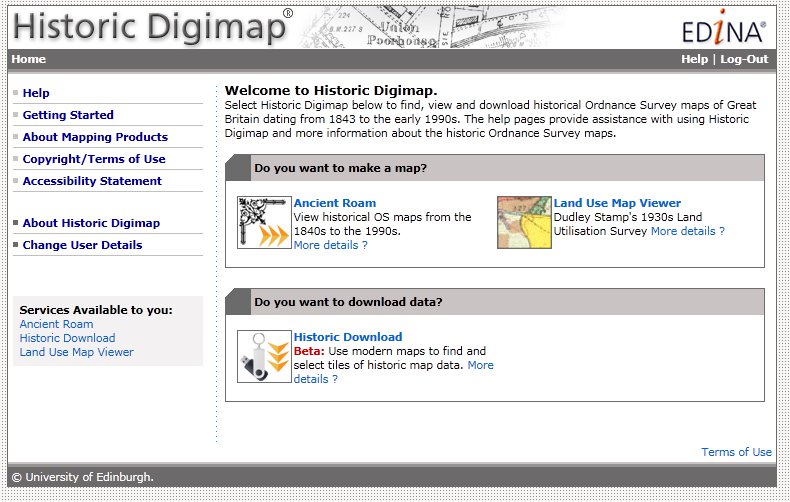
We are now at the start of a new academic year and Digimap has new licence agreements in place for the Ordnance Survey, Geology and Historic Map and Data Collections. You may have noticed already that you have been asked to agree to the licence again when you logged in. This is because some of the terms are different and you are required to agree to these new terms prior to accessing the data within the service.
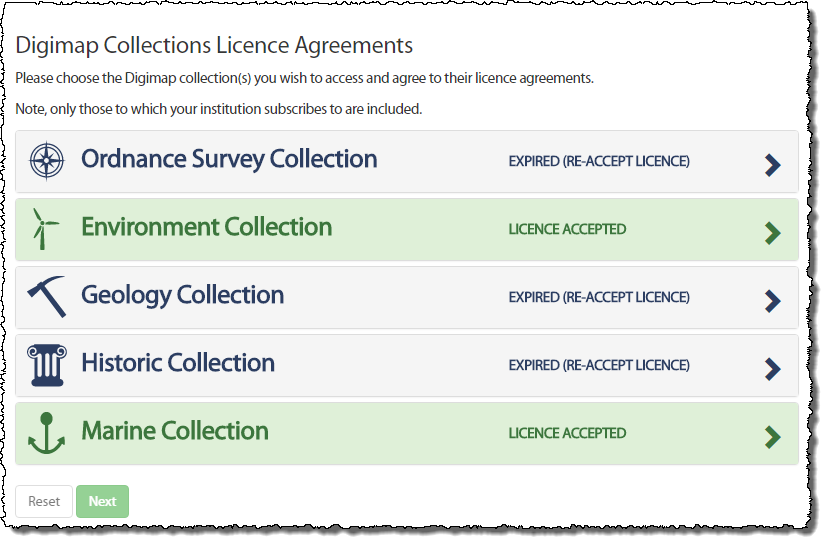
When you login you will notice the Licence Agreements button at the top right of the home page.
Clicking on this will allow to you to view the licences you have agreed to and to agree to those you have not yet agreed to.
If a Collection has a new licence, the applications (e.g. Roam and Data Download) in that Collection will also appear grey. By trying to access an application which has a new licence, you will automatically be taken through the process of agreeing to it if you have not yet done so.
All you need to do is accept the licence and restate your purpose for using the service (which may or may not have changed since you agreed to the previous licence) and you will have access to the service once more.
If you have any questions or need any help or guidance have a look at the Agreeing to Licences for Digimap Collections section half way down the following help page:
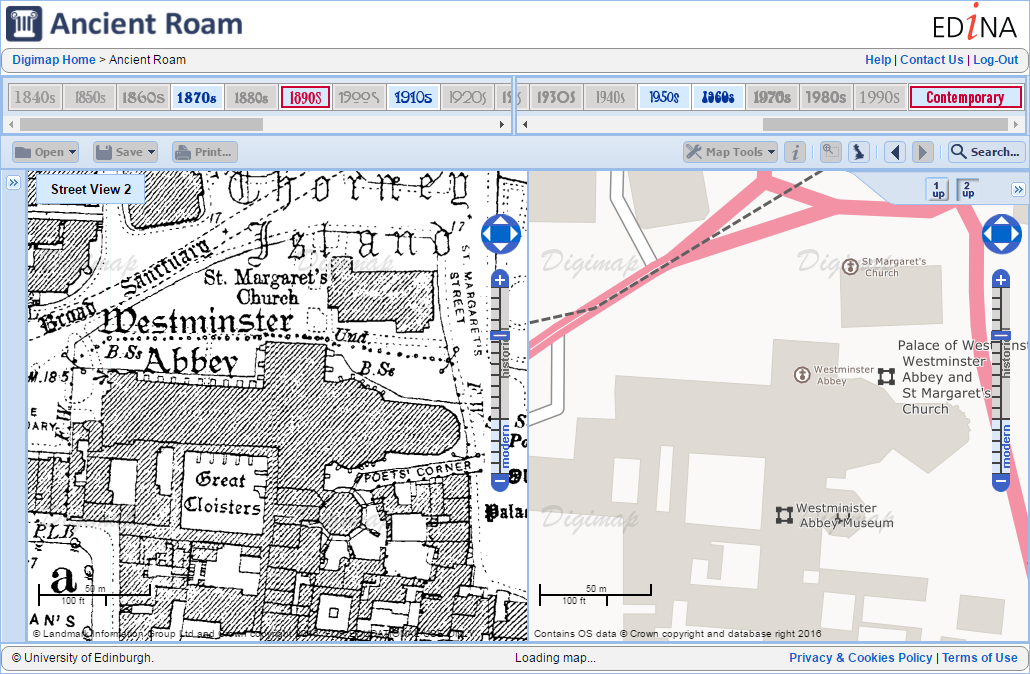
We have recently added detailed, large scale, contemporary mapping to Ancient Roam allowing users to compare side by side historic mapping with detailed modern mapping.
The detailed modern mapping is visible at all zoom levels in both the 1-up and 2-up views. The most detailed mapping uses the new OS OpenMap – Local product, which is the most detailed Open Data product available from Ordnance Survey and can be downloaded through the Digimap Ordnance Survey collection. We further enhanced the most detailed mapping to include the additional features from OS VectorMap District:
Contours
Spot heights
Medical centres
Police stations
Heritage sites
Places of worship
The other products we have added are OS StreetView and OS VectorMap District Raster to provide a comprehensive set of contemporary map data suitable for all zoom levels in Ancient Roam.
We hope you find the new data useful, if you have any questions about the updates or Digimap please contact us:
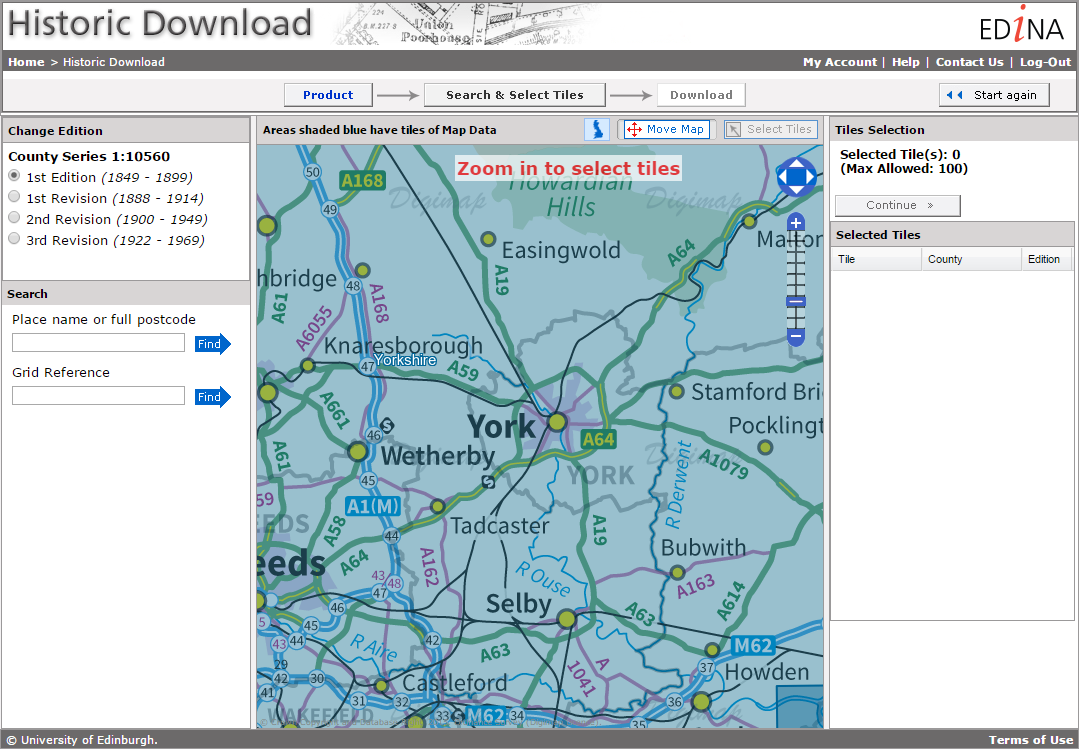
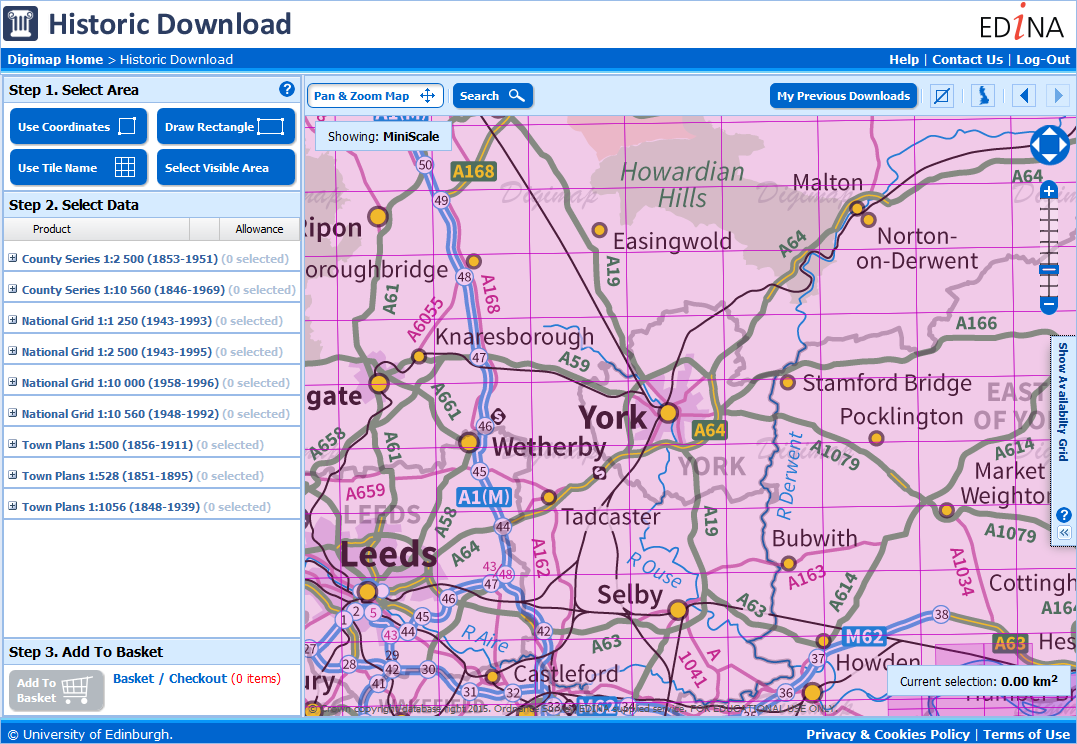
EDINA will be withdrawing the old Historic Download on Friday the 11th of December. With most people now using the new Historic Download we have taken the decision to switch off the old version to free up resources. The new interface contains all the same data but allows you to take multiple products and revisions in a single order. Existing users’ Download History from the old interface will NOT be available to reorder from the new interface so please make sure you have made all the necessary orders in the old interface before the 11th.
New Historic Download
Please note that if you want a definitive list of published dates for the maps you download from the new interface, it is available in the contents.txt file delivered in your zip folder with your data. This text file has the details for every tile / sheet of map data you have taken.
The old Historic Download was the last remaining download interface that was different to the other collections, so now every collection uses the same interface to retrieve data for use in CAD or GIS software.
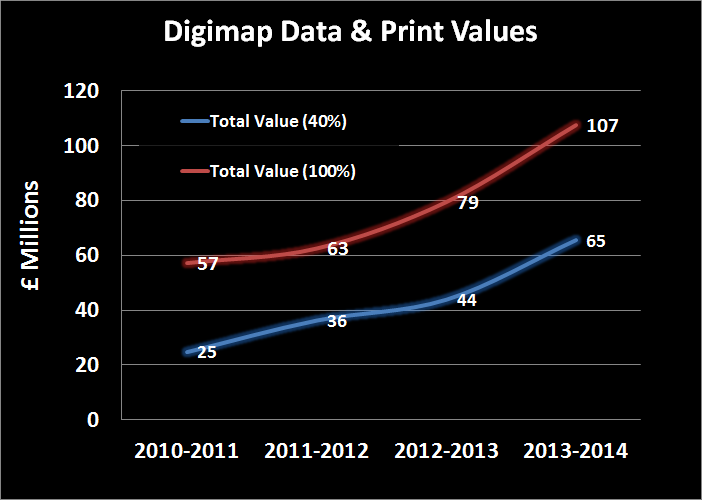
As part of our work to demonstrate the value for money of the Digimap Collections, EDINA has calculated the commercial cost of all the data downloaded and maps created for printing. We calculated the values per institution for the period August 2013 to July 2014 then totalled them; this came to approximately £65.4 million. This estimate is a conservative one because we reduce the quantity of data downloaded by 60% to account for duplication. When all the maps printed and data downloaded were included in the calculation (i.e assuming users would continue to take their own data and maps, and not share them) this total rises to over £107 million.
Click to enlarge image
We know that some data is downloaded multiple times within an institution, for example by students for a class exercise or by researchers for specific study sites. We found that on average only 40% of the data taken from Digimap over a period of time was unique within an institution. We believe that if institutions were paying commercial rates for their data they would be more likely to download it once and circulate it to those who need it; this is why we reduce the amount of data included in our calculation. However, there is considerable variation between institutions as to how much is unique; those that do more research or are smaller in size tend to have a greater proportion of unique downloads, so we calculated the 100% figure as a ceiling value.
In total, over the past four academic years over £306 million (£170 million at 40%) worth of print maps and data has been served up from Digimap to subscribing institutions. The steep increase in 2013-14 was caused by more Ordnance Survey products being downloaded and printed than ever before and also by the high commercial costs of several products added to the Geology Digimap service.
How the Costs are Calculated
Click to enlarge image
The costs used in our calculations for the data come from the list prices published by data suppliers, and include any relevant multipliers or discounts declared publicly on their websites.
The data costs we calculated are done on a per product / per institution basis, with the data preparation and licensing charges assigned only once per product, per institution (rather than per data request). Many of the data collections are commercially licensed based on the number of users who have access to the data; with increasing numbers of users a multiplier is applied to a base cost. We applied the relevant multipliers according to the number of active registered users for each Collection at an institution.
We capped data costs at the price of national coverage for each product, making it impossible to assign greater cost for any one product than it would be to supply the entire dataset for use by a whole institution.
The values for the print maps (including saved maps in all Roam applications) are calculated by finding the cheapest commercially available map prints from websites such as eMapsite, NLS and FiND.
What We Didn’t Include
Click to enlarge image
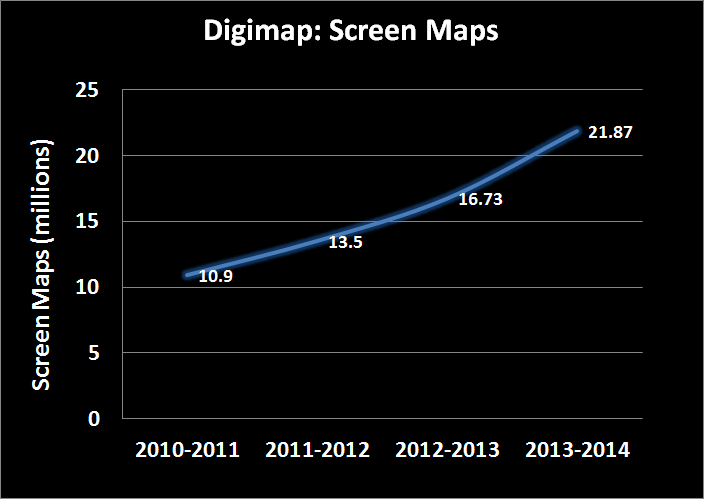
No monetary values were assigned to the millions of screen maps that are produced from Digimap. The value calculated also doesn’t take into account any of the help materials, training courses and support facilities that are all part of the Digimap service.
No OpenData downloads or maps created from OpenData are included in the calculation, despite the advantages of producing them from Digimap rather than other websites.
However, the biggest saving that isn’t included in these value calculations is your time. We only charged the data supplier’s preparation and licensing costs once per product or order, in line with each company’s policy where it applied. In reality there would be many orders occurring throughout an academic year as new research questions are raised. This all costs time, time which the data suppliers will charge for or that institutional staff would have to take to submit requests for data and time for staff to create and manage a repository for spatial data.
With 24 hour access to high quality data and maps through a purpose built mapping and data download interface, Digimap does all this work for its subscribers.
Over the coming weeks we will be sending out each institution’s data cost calculations to Digimap site representatives. If you are interested in the commercial costs of the maps and data your institution has been using please contact your site represenative. If you are unsure who your site representative is, please contact us:
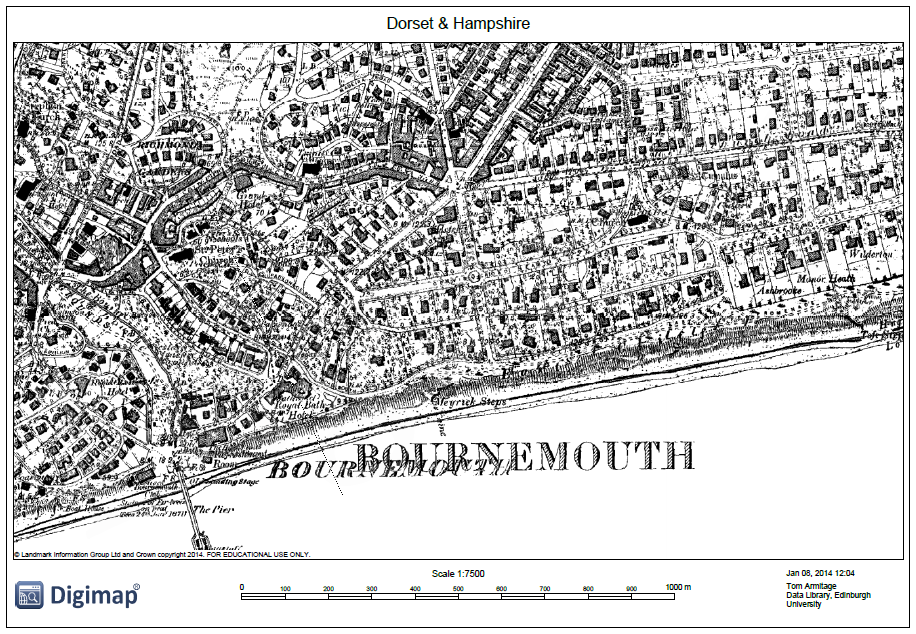
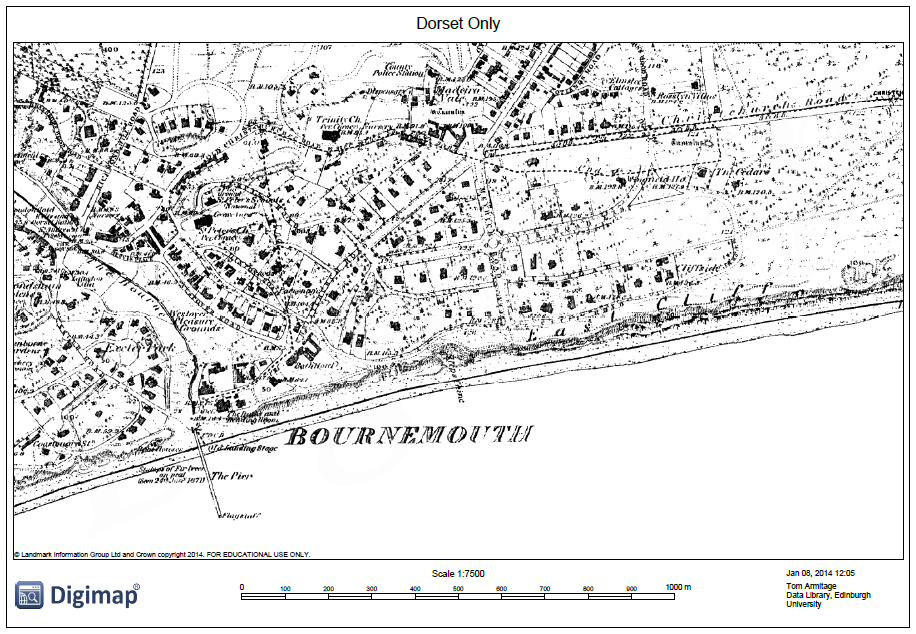
Ancient Roam in Historic Digimap has had its print options updated so it now has the same set of options as the other Roam facilities. The two big changes to note are that you can now print up to A0 and that you can print a single county in areas where several overlap.
Until this change was made it was impossible to print an area with overlapping maps without printing all the counties available rather than just the one(s) you were viewing on the screen. Any print files now generated in areas with overlapping counties will only show those which are displayed on screen. This allows you to have the control over how much information is on your map and to make the decision to show more or less information.
Sometimes it can be an advantage to show multiple counties as even though the sheets overlap the actual map information doesn’t. However in the example above you can see how the counties overwrite each other in the map on the left and so produce a very confusing and fairly useless result; by switching one county off you can produce a much clearer print map such as the one on the right. [Click on the images above to view larger versions of the maps.]
The ability to print maps up to A0 brings Ancient Roam into line with the other Roam facilities so you can now print at this very large size in any Digimap collection.
You can now download high quality PDF maps from Ancient Roam for printing. This element of the service has been quite tricky to implement, so until now we have only had the save image button to get a PNG image of the map you are viewing.
Now you can use the print button to access a similar interface to the ones found in all the other Roam services. You can see a sample PDF by clicking on the thumbnail below:
A Sample PDF from Ancient Roam.
There are still a couple of options to add into Ancient Roam print maps; we need to add the ability to print 2up maps and the ability to switch off counties in areas where there are overlapping maps. Look out for these arriving in the near future.
Information about how to use all the features of Ancient Roam can be found on the following help page:
On Tuesday 1st March, EDINA will be updating the metadata for the historical maps in Historic Digimap. The metadata changes will affect only the Scottish County Series maps and will mean that some maps will appear to “move decade”. More details of the implications of these changes are given below.
Accuracy of publication dates
When the maps were originally scanned, the detailed marginalia on the original paper map sheets was not captured at the same time. The marginalia contained information such as the survey year, publication year, re-publication year (if applicable) and surveyor name. During the digitisation process only one year from the marginalia was recorded; it is assumed this was the publication year but there was always some uncertainty around this.
A joint project between EDINA and the National Library of Scotland (NLS) was undertaken to digitise the marginalia of the original paper copies of the historical maps held by NLS. The metadata captured included the Survey Year and Publication Year. Until now, the survey year of all maps in Historic Digimap was unknown. We now have the survey year for a significant number (but not all) of the County Series maps for Scotland at both 1:2500 and 1:10 560 scales.
The significance of this project to Historic Digimap is that we can now use the more accurate and reliable publication dates for many of the County Series maps to improve the mapping and download facilities offered. In order to make use of the new NLS publication dates, these were matched with the original metadata using a series of rigorous database queries and manual processing.
How many maps have changed?
Consequently, around 35,000 County Series map tiles* (18%) now have survey years. Of these, around 28,000 tiles also have a more accurate publication date. In the majority of cases (over 70%) the publication date has only changed by a year or two. For nearly 2,000 tiles the change in publication date is more than 10 years, with the largest single change being 39 years. For those tiles which have not had updates to the survey year, the Landmark publication year used remains unchanged.
So what does this mean for Ancient Roam and Historic Download?
Nothing has changed in Historic Download in terms of how historical maps can be found and downloaded, but the updated publication dates will be reflected in dates provided on the order summary page in the downloader. These will be more accurate and reliable than previously.
For Ancient Roam, there are some more significant effects. The publication date is used to determine which maps are visible in each decade given in the timeline along the top of the map screen.
Many of the maps for which the publication date has changed by one or two years will remain within the same decade and therefore will not be affected. However, for some maps a change of a year or two in the publication date may be enough to shift the map from one decade to another. For example, a map previously thought to have been published in 1889 but now known to have been published in 1901, originally appeared in the 1890s decade but now appears in the 1900s decade.
Where there have been more significant changes in the publication date some have resulted in entirely new decades being available in the timeline for particular areas. For example, in Forfarshire there were two County Series editions in the 1890s. This was because maps originally published in the 1860s and 1870s were re-published in the 1890s. So where no maps appeared for Forfarshire in 1860/70s, they do now!
Other maps with significant publication date changes tend to be odd outlying tiles that for some reason had a significantly different date from neighbouring tiles. This means that some odd ‘holes’ have been filled.
How do I find out the map date source?
In addition to the new survey and publication data information, the Map Details information box will also be updated. A new icon has been added to the tool bar to access the map information and the information box styling has been updated in keeping with the other Digimap Roam clients. Three new attributes have been added to the Map Details information: Year Surveyed (where applicable), Sheet Title (where applicable) and Date Source. The Date Source information will tell you whether the publication year came from the original Landmark data or the NLS metadata.
While these changes to Scottish County Series maps means that the per decade classification is now different, the changes mean that the dates are now more accurate. Our thanks go to the National Library of Scotland for their hard work on this project.
The updates to Historic Digimap will take effect on the evening of 1 March 2011.
*Map tiles refers to the ‘cookie-cut’ National Grid versions of the maps, not the original County Sheets