Any views expressed within media held on this service are those of the contributors, should not be taken as approved or endorsed by the University, and do not necessarily reflect the views of the University in respect of any particular issue.
Digimap is an online map and data delivery service, available by subscription to UK Higher and Further Education establishments. Operated by EDINA at the University of Edinburgh, Digimap offers a number of data collections, including Ordnance Survey, historical, geological, aerial photography, LiDAR, marine maps, land cover mapping, global mapping and census data. For more information about Digimap go to our website: https://digimap.edina.ac.uk Background image Contains OS data (c) Crown Copyright and database right 2022
Join us for an engaging session on Marine and Coastal Mapping, led by Bella Ormerod, Marine Data Technician/Engineer from OceanWise. Bella will introduce key datasets and tools used in marine environments and explain their applications in real-world coastal mapping projects.
Date: 4 November 2025
Time: 1:00 PM
You can register Here
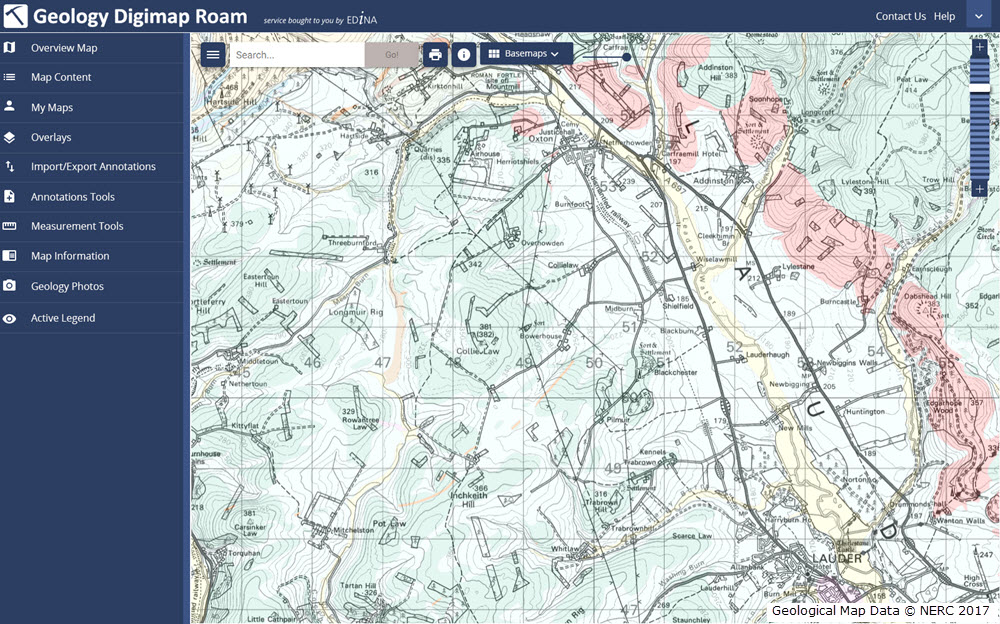
As mentioned at Geoforum earlier this year, we’re currently working hard on a new version of Digimap Roam. The new-look application will bring Digimap Roam, the online mapping tool in the Digimap family, bang up to date with the latest web technologies available. Whilst the functionality will remain the same, the look and feel of the interface will be more modern. The majority of functions will be available from a new menu panel down the left hand side which is hidden by default maximising the area available for the main map element. By utilising the latest technologies we will be able to add new functionality and make further enhancements to the application in the future.
The new interface makes further improvements to the experience on mobile devices, an area where we’re seeing an increase in usage across the service. A mock up of how the new Geology Roam interface might look is included below to give you an idea of the proposed layout and styling:
Mockup of the new Geology Roam interface
Currently we are on target to launch the new interface early in the first semester of the 2017-2018 academic year, but we will post progress updates on this blog as the new interface approaches completion. There will be a phased release with the new Roam applications with the Ordnance Survey Collection being first in line.
We appreciate that you may have teaching or lecture materials that may require updating as a result of this change in interface, so we will run all the existing Roam applications alongside the new versions so you can get up to speed with the new interface whilst the existing versions are still available. At the moment we anticipate running both versions in each Collection side by side until at least the end of the year. During this period we would welcome any comments and feedback that you may have.
As ever, if you have any questions about the new Roam, please do not hesitate to contact us.
Lots of datasets were updated in March and April this year, with the majority of updates being to data in the Ordnance Survey Collection of Digimap. We also updated the vector marine data in Marine Roam so that it is now displaying the same version that is available for download through Marine Download; the Borehole data in Geology Download has also been updated to the latest version.
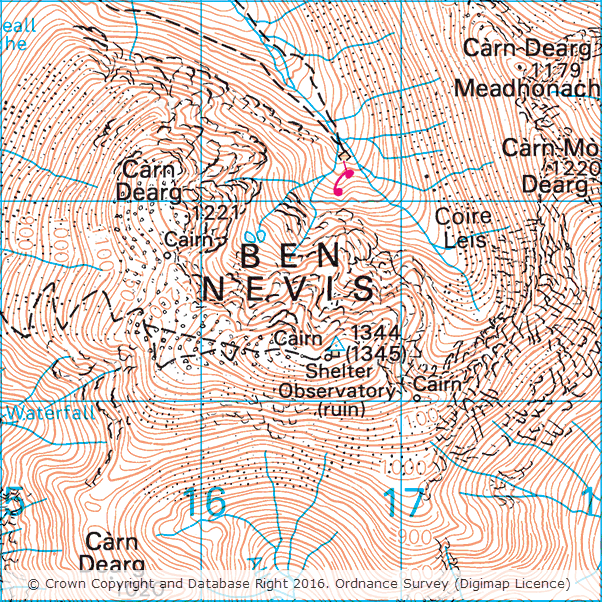
The updates include the latest versions of the 1:50,000 and 1:25,000 Colour Raster products which show the new height of Ben Nevis. The mountain, which is the tallest in Britain, was recently resurveyed by OS and found to be one metre taller than the measurements taken during the previous survey in 1949. If you’re interested in finding out more about the resurvey, and why two different heights are shown for the summit on the maps, the Ordnance Survey have published a blog post which explains the process in detail.
The tables below detail all the datasets that were updated recently in each Collection along with the publication dates of each one.
OS Data Download:
Product Name
OS Publication Date
1:25,000 Colour Raster
March 2016
1:50,000 Colour Raster
March 2016
MasterMap Topography Layer
January 2016
VectorMap Local
January 2016
VectorMap Local Raster
January 2016
VectorMap District
March 2016
VectorMap District Raster
March 2016
Terrain 5 Contours
January 2016
Terrain 5 DTM
January 2016
Code-Point with Polygons
January 2016 and April 2016
Code-Point
February 2016
Code-Point Open
February 2016
Points of Interest
March 2016
Open Names
March 2016
MiniScale
January 2016
* OS Street View
April 2016
* Meridian 2
July 2015 and January 2016
* Strategi
January 2016
OS Roam:
Product Name
OS Publication Date
1:25,000 Colour Raster
March 2016
1:50,000 Colour Raster
March 2016
MasterMap Topography Layer
January 2016
VectorMap Local
January 2016
VectorMap Local Raster
January 2016
VectorMap District Raster
March 2016
Terrain 50 Contours
July 2015
MiniScale
January 2016
* Meridian 2
January 2016
* Strategi
January 2016
* Note: these are the last updates to OS Street View, Merdian 2 and Strategi that will be supplied by Ordnance Survey who have announced that they are retiring these products. Whilst the data will still be available to download through Digimap, these products will no longer be updated to reflect changes in the real world.
As well as all the changes in the Ordnance Survey collection, we have also updated the vector data in Marine Roam from Seazone Solutions. This brings the data up to date with the latest version of the product from SeaZone Solutions, which is also available for download through Marine Download.
Product Name
SeaZone Publication Date
HydroSpatial One
August 2015
Geology Download:
Finally the Borehole data available in Geology Download has also been updated to the latest version available from the British Geological Survey.
Product Name
BGS Publication Date
Onshore Borehole Index
January 2016
If you have any questions about the dataset updates or Digimap please contact us:
A number of key datatsets have been updated in Digimap this December in several of the collections.
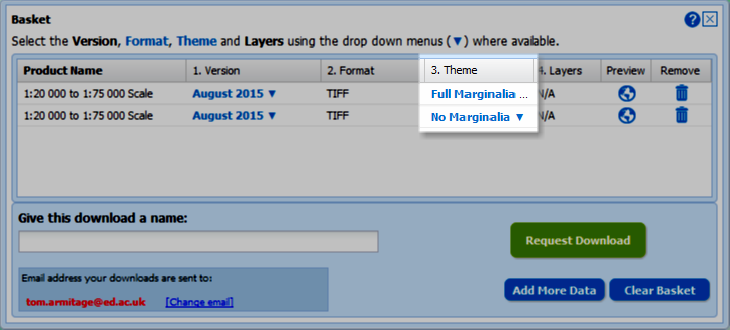
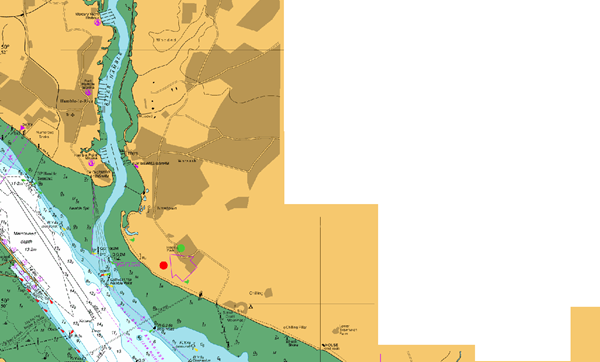
Of particular note are the updates to the Marine collection. The HydroView Charts raster product from SeaZone is now available in two versions: ‘Full Marginalia’ and ‘No Marginalia’. Users can select the version after adding the product to the basket in Marine Download.
The ‘No Marginalia’ version has all extra information round the map (e.g. north arrows, scale bars, inset maps etc.) removed and replaced with transparent areas. This makes it ideal for use in GIS software allowing you to pan across adjacent charts without this information obscuring the map data.
Furthermore the Charted Raster .tif files are now supplied with .tab files for accurate positioning in MapInfo.
The tables below lists all the datasets that have been updated in each collection together with the publishing date for each one.
Ordnance Survey Data Download
Product Name
OS Published Date
Boundary-Line
October 2015
Geology Download
Product Name
BGS Published Date
Boreholes
January 2015,
April 2015,
July 2015,
October 2015
Marine Download
Product Name
SeaZone Published Date
HydroSpatial One
August 2015
HydroView Charts (all scales)
August 2015
If you have any questions about the dataset updates or Digimap please contact us:
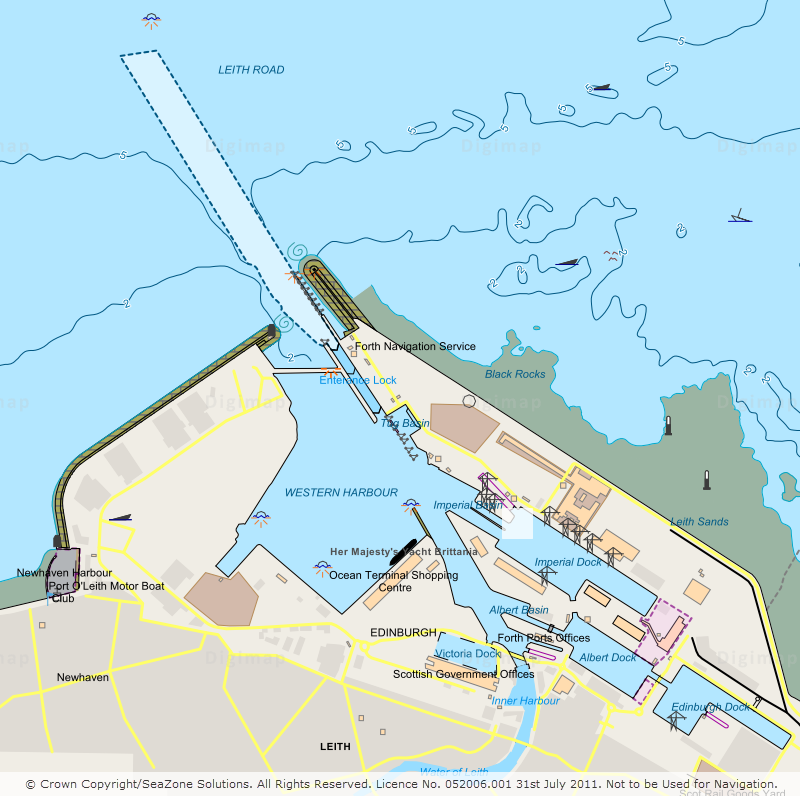
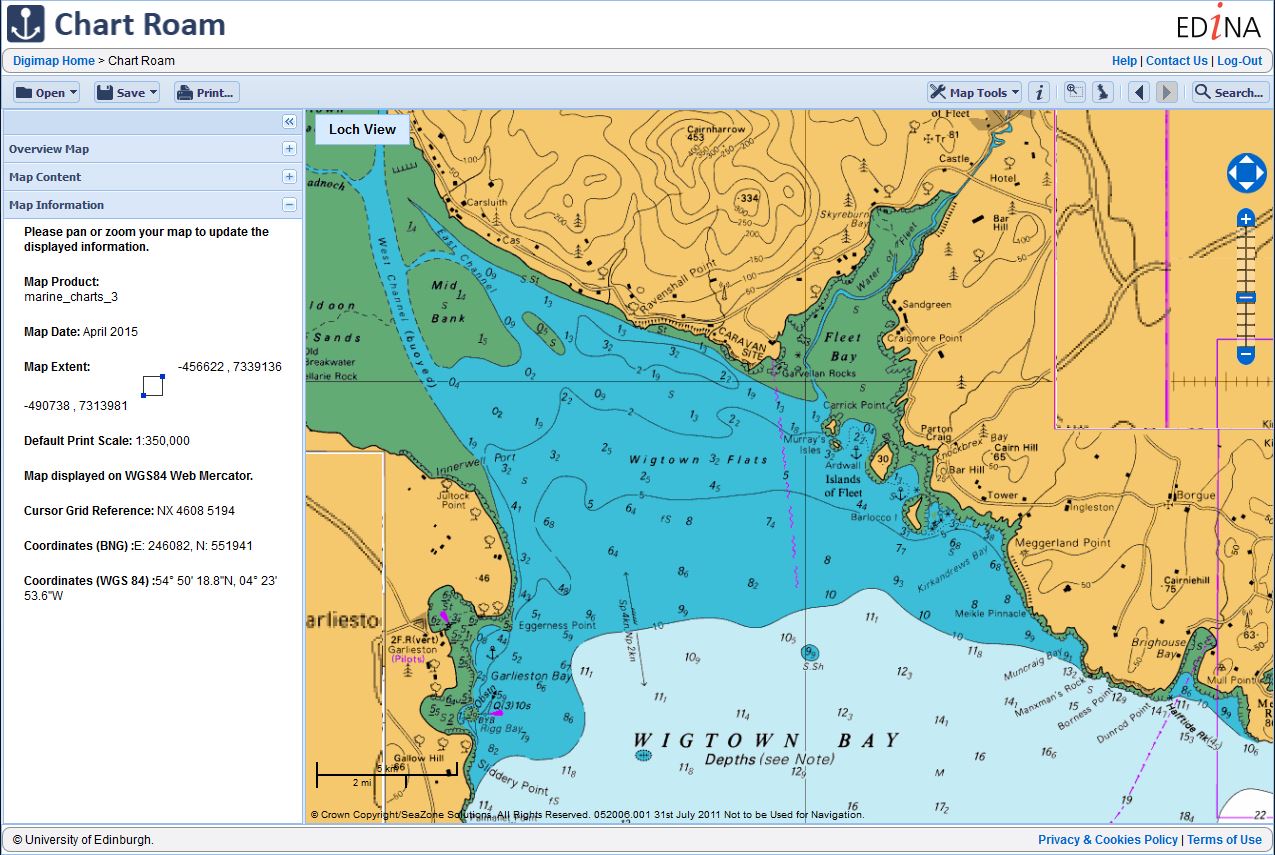
In January 2016, the Marine Maps application available through Marine Digimap will be replaced by a new application called Chart Roam.
As it’s name suggests, the new application will offer the same Chart data currently available through Marine Maps. SeaZone (the data supplier) now call this dataset HydroView Charts. They were previously referred to as the Charted Raster data.
Chart Roam will operate in the same way as all other Roam clients available, offering slippy maps, 12 fixed scale map views, annotation and measurement tools, as well printing in multiple file formats and sizes up to A0.
A date for release will be advertised in the new year.
If you have any questions, please do not hesitate to contact EDINA on edina@ed.ac.uk.
As part of our work to demonstrate the impact of Digimap, EDINA has calculated the commercial value of all the data downloaded and maps created for printing. We calculated the values per institution for the period August 2012 to May 2013 then totalled them; this came to approximately £39 .5 million. This estimate is a conservative one as we reduce the quantity of data downloaded by 60% to account for duplication. When all the maps printed and data downloaded were included in the calculation (i.e assuming users would continue to take their own data and maps, and not share them) the value rises to nearly £71 million.
Click to enlarge image.
We know that some data is downloaded multiple times within an institution, for example by the students in a class exercise or for specific study sites. We found that only 40% of the data taken from Digimap over a period of time was unique to an average institution. We believe that if institutions were paying commercial rates for their data it would be more likely that they would try to download it once and then circulate it to those who need it; for this reason the value calculations only include 40% of the total. However, there is considerable variation between institutions as to how much is unique; those that do more research or are smaller in size tend to have a greater proportion of unique downloads, so we have included the 100% figure as a ceiling value.
In total, over the past three academic years over £190 million (£100 million at 40%) worth of print maps and data has been served up from Digimap to subscribing institutions.
How the Costs are Calculated
Click to enlarge image.
The costs used in our calculations for the data downloaded come from the data suppliers, and include any relevant multipliers or discounts made publicly available on their websites.
The data values are calculated on a per product / per institution basis, with the data preparation and licensing charges assigned only once per product, per institution. Many of the data collections are licensed based on the number of users who have access to the data; with increasing numbers of users a multiplier is applied to a base cost. We applied the relevant multipliers based on the number of active registered users for each collection at an institution. SeaZone data is provided commercially through a third party website; we picked the closest match possible to the data we provide though this does have a lower cost, again making the estimates conservative.
We capped data values at the price it would cost to take national coverage of each product, making it impossible to charge more for any one product than it would to supply the entire dataset for use by the whole institution.
The values for the print maps (including saved images in Carto and Ancient Roam) are calculated by finding the cheapest available commercial map prints from websites such as eMapsite, NLS and FiND. These values are updated every time we calculate the values.
What We Didn’t Include
Click to enlarge image.
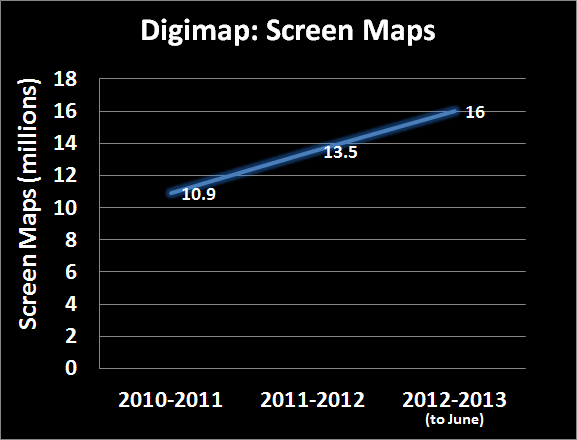
No monetary values were assigned to the millions of screen maps that are produced from Digimap; we couldn’t find a comparable site! Also, the value calculated doesn’t take into account any of the support materials, training courses and help desk facilities that are all part of the Digimap service.
No OpenData downloads or maps created from OpenData are included in the calculation, despite the advantages of producing them from Digimap over other websites.
However the biggest saving that isn’t included in these value calculations is your time. We only charged the data supplier’s preparation and licensing costs once per product or order, in line with each companies policy. In reality there would be many orders occurring throughout an academic year as new research questions are raised. This all costs time, time which the data suppliers will charge for or that institutional staff would have to take to put in requests for data or to create and manage a repository for spatial data.
Digimap does all this work for its subscribers along with providing a high quality mapping interface, 24 hour access to expensive high quality data and maps.
Over the coming weeks we will be sending out each institution’s values to Digimap site representatives. If you are interested in the value of the maps and data your institution has been using then get in touch with them. If you are unsure who your site representative is then please contact us:
Marine Roam is a fantastic service which provides access to SeaZone HydroSpatial data for the waters around Great Britain. There are many applications for the data and the expanding offshore renewables sector, and associated research around it, immediately springs to mind. However, did you know that you can use Marine Roam for some historical sleuthing?
70 years ago today, 27th march 1943, HMS Dasher was sailing up the Firth of Clyde heading for Greenock. HMS Dasher had been converted into an aircraft carrier and was home to 8 Swordfish and 2 Sea Hurricanes. The planes were being refuelled following landing practice when there was a series of massive explosions. The ensuing fire could not be contained and the ship was abandoned. It sank just 6 minutes after the first explosion. While 149 seamen were recovered, 379 lost their lives.
Wrecks are marked in the HydroSpatial data and can be queried in Marine Roam. It is a little tricky to find the wreck of HMS Dasher. I knew it was situated in the Firth of Clyde, mid-way between Arran and the mainland, about 5 miles south of Little Cumbrae. However, the only wreck I could find was that of the Antares, a fishing trawler which sank in 1990 after its nets were apparently snagged by a submarine. After a bit of hunting I found some strange boat shaped features, seemingly related to military wrecks which for the most part appear to have been sunk during exercises. One of these marks the resting place of HMS Dasher. Below is a screenshot of the attribute information held in the HydroSpatial data about her.
Wreck of HMS Dasher in Marine Roam
You can log into Marine Roam and use the Info Tool to explore features on the map. Alternatively, you can download the data through Marine Download and load it into a GIS for further exploration.
So what other famous ship wrecks can you find in Marine Roam? Why not post a comment with the coordinates of your favorite sea-floor find.
We have implemented a new Help system for the Marine and Geology Digimap collections (Marine Help and Geology Help). The Help pages have been moved to a new production system which will make is easier for us to keep them more up to date and allow you to find the information you are looking for more easily and print better looking pages.
Visually there is not much change to the pages but over the coming months we will be updating and revising the content of the Help pages within Digimap to provide users with improved access to information about the Digimap facilities, the data available and how to use the data in different systems.
If you have any comments about the new Help pages or suggestions please let us know.
Tip: if you want to search for a phrase put it in quotes e.g. “zoom to position”
Yesterday, Tuesday 26 January 2010, some changes were made to Digimap. These are detailed as follows:
1. Classic removed from Ordnance Survey Collection.
As advertised on 5 October 2009 and 6 January 2010 this old facility has been removed and replaced by the new Roam facility. You can find a demonstration of Roam on the EDINA website: Roam demonstration
2. Historic Digimap “preview map sheet” button has been removed.
This function used out-of-date technology to render the original historical map sheets in the browser window. It was extremely slow and was dependent upon software installed on a machine which is being decommissioned. It is much quicker and more user-friendly to download the map sheet required and view it locally.
3. Marine Digimap Hydrospatial data updated.
The 2009 version of SeaZone’s Hydrospatial data is now available through Hydrospatial Download. Late delivery of the data has meant a delay of the release from September 2009 to January 2010.