Save, Import & Export Annotations from Digimap Roam

Save, Import and Export Annotations tools for Roam
From left to right: “View saved annotations”, “Save annotations”, “Import” and “Export”.

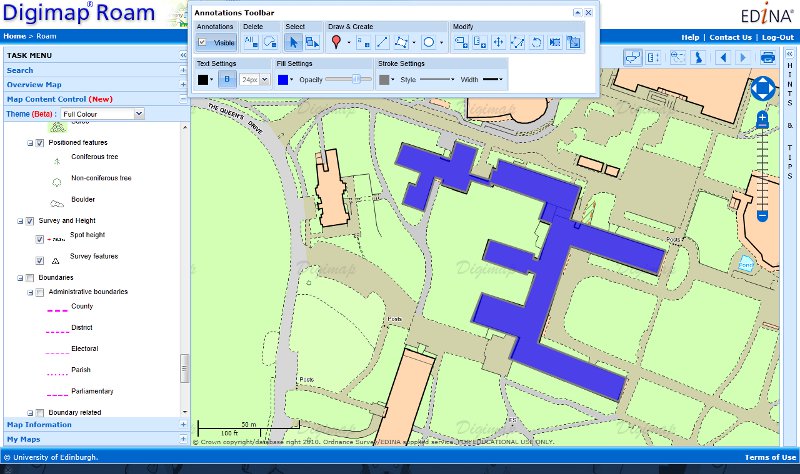
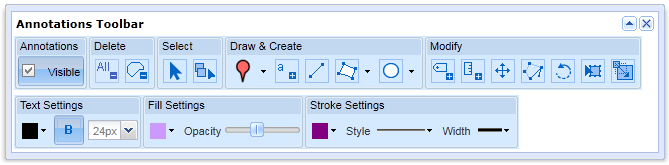
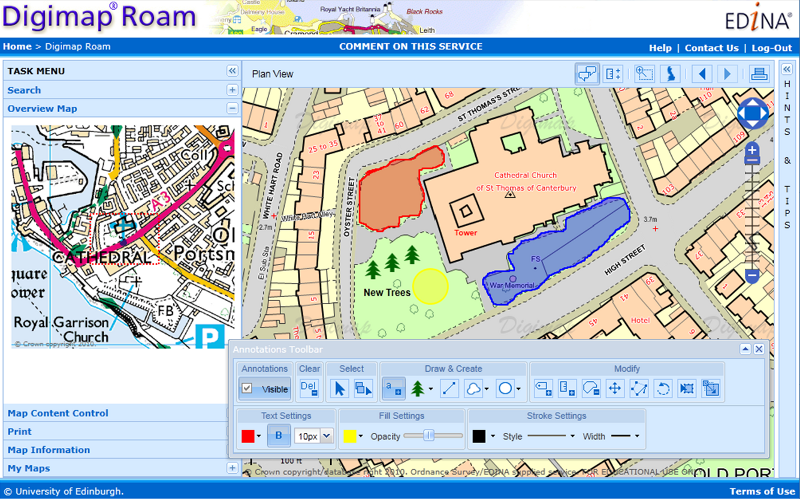
Recent enhancements to all Roam applications in Digimap (OS, Geology, Ancient and Marine) mean you can now save, import and export annotations. The new tools can be found under the ‘My Annotations’ set of tools on Annotations Toolbar.

The new Save function enables you to work on creating and editing annotations in more than one Digimap session. You can now save your work and come back to it another day. Hit the Save button to store your annotations and retrieve them any time by clicking the ‘View saved annotations’ button. Any annotations that you save in one application (e.g. OS Roam) can be opened in any other Roam client (e.g. Ancient Roam) you have access to. This is a great function that enables you to digitise a set of annotations based on one type of map, and then open them up in another Roam application to view on a different type of map. For example, you could use OS Roam to annotate a detailed map showing a proposed new building. You can then save those annotations and open them up in Geology Roam to view the geology underneath your proposed new building.

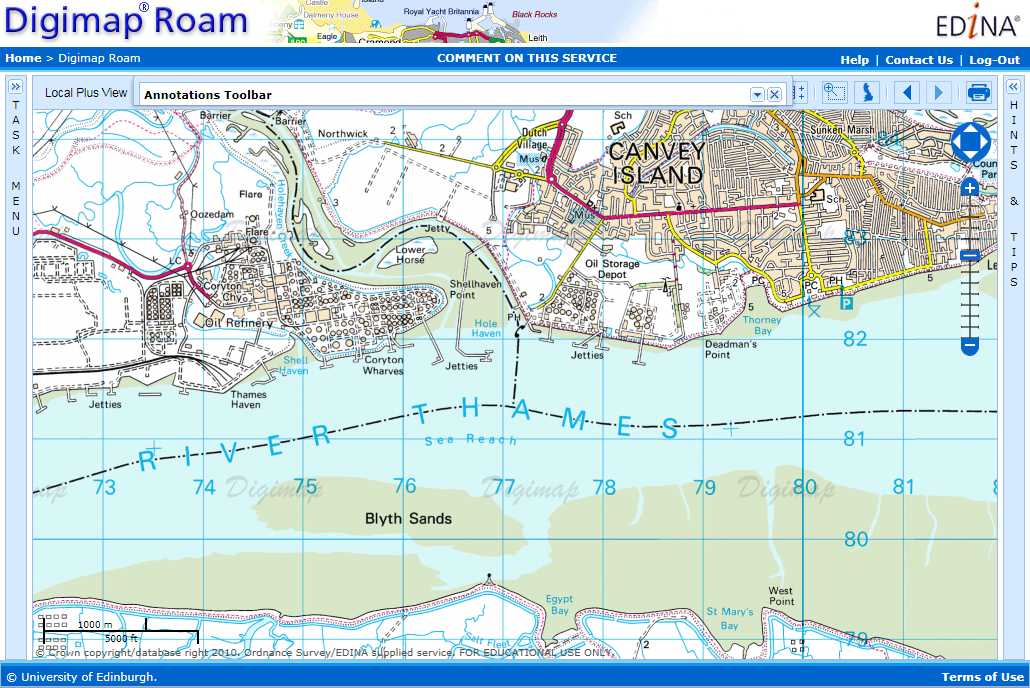
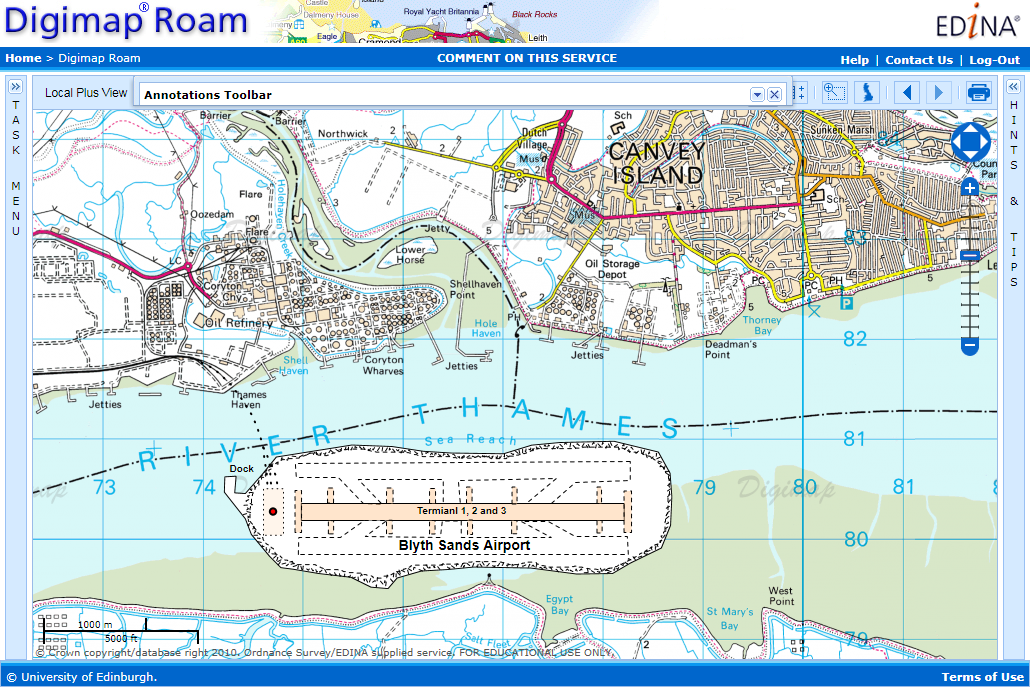
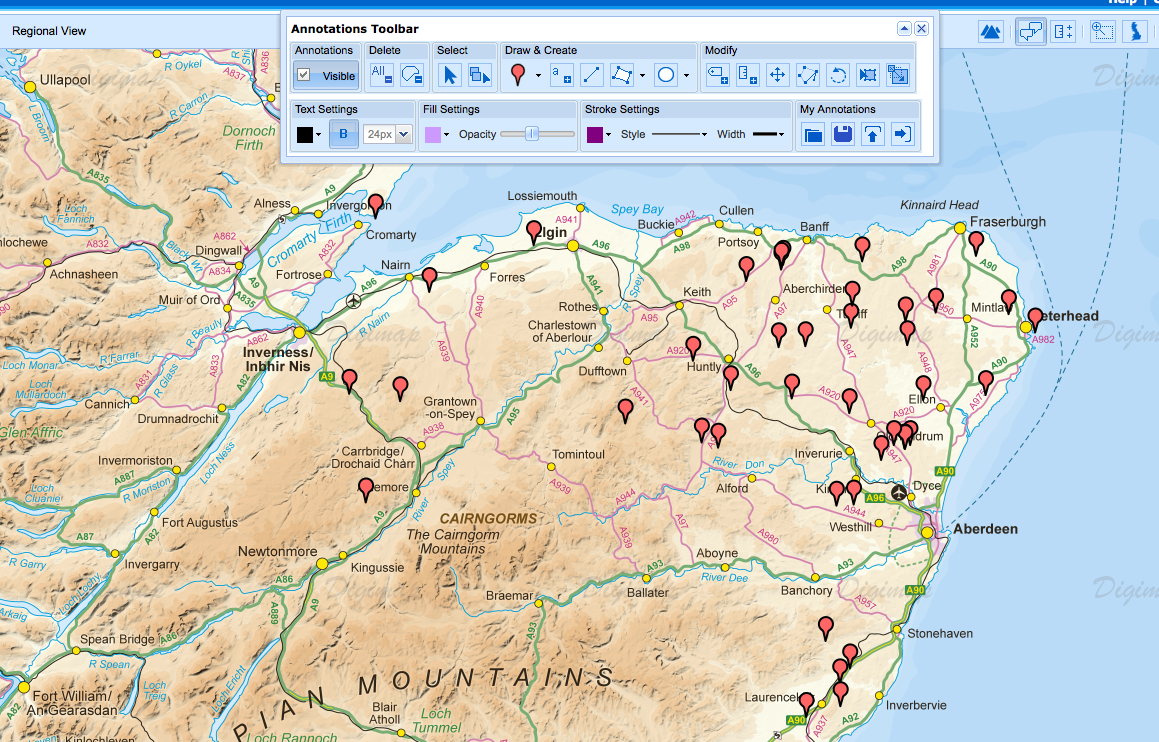
If you have a spatial dataset, you can now import it into any Roam application to view those features as annotations. This could be a dataset you have created in a GIS, downloaded from Digimap or another data provider, tracks or points surveyed using a GPS unit or a geocoded table of survey results. You can import Shapefiles, KML, GPX, CSV and GeoJSON datasets. Click the ‘Import’ button under ‘My Annotations’ on the toolbar and navigate to your dataset to import. This feature means you can quickly and easily visualise datasets that you have created or obtained from elsewhere on top of maps in any of the Roam clients.

Proposed Wind Farm locations dataset downloaded from ShareGeo Open (http://hdl.handle.net/10672/294) as a shapefile and imported into Roam as annotations.

In addition to importing, you can also export your annotations  in Shapefile, KML and GeoJSON formats by clicking on the “Export” icon on the My Annotations tools. These formats cover the most popular GIS and Web Mapping software packages, such as ArcGIS, Quantum GIS, Google Earth and OpenLayers.

For more information on using the Annotation Tool have a look at the “How to” help page here: How to use the Annotation Tools in Digimap Roam

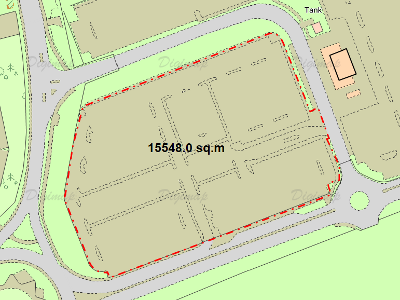
NOTE:If you create annotations by tracing features on a Roam map you will need to credit any maps you go on to make using the annotations with the appropriate copyright statement. Any geographic data you generate from a map is called “derived data” and is still copyright to the creators of the original map.

The copyright statement is added automatically if you print the map from Roam, however you will need to add in the statement manually if you export annotations and use them in other software. The statement to include can be found in the Terms of Use for the service you are using, just click the link a the bottom right of the Roam interface.

Annotations Tools in Ancient Roam

Ancient Roam now has the annotation tools, so all the Roam facilities allow you to add your own features (symbols, lines, polygons and text) to the map.

Ancient Roam Annotation Tools

We are always looking for feedback so if you have any requests for symbols, line styles or any other features you would like put on the map, let us know. You can comment on this post or email us directly here:

Mailto: EDINA help desk

Remember there is a video on how to use the general features of the Annotation Tools on YouTube:

[youtube width=”640″ height=”390″]http://www.youtube.com/watch?v=PSkTZvMNyKU&hd=1[/youtube]

2011 Data Update

This year’s annual data update will take place at the beginning of September.  There will be a refresh the following Ordnance Survey products:

MasterMap Topo

  • MasterMap Topography and ITN Layers
  • VectorMap Local
  • Meridian2
  • Strategi
  • MiniScale
  • Code-Point
  • Code-Point with Polygons
  • Boundary Line

1:250,000 Colour Raster

  • 1:250,000 Colour Raster
  • 1:50 000 Colour Raster
  • 1:25 000 Colour Raster
  • 1:10 000 Raster
  • 1:50 000 Scale Gazetteer


There will also be updated Hydrospatial data in Marine Digimap and a new version of the DiGMapGB-50 data in Geology Digimap.

Along with the new data Ancient Roam will be getting the Annotation Tools and there may be a bit of a surprise bonus addition to Digimap Roam. More information will be posted on the Blog, Twitter and Facebook page nearer the time.

Some Fun with the Annotation Tools

We have been having a play around with the new annotation tools in Digimap Roam here at EDINA, and have come up with a few things you might like to try.

Firstly, you will have no doubt been adding many new features to maps but have you tried taking some away?

A farm shown in Digimap Roam
© Crown copyright/database right 2010. Ordnance Survey/EDINA supplied service. FOR EDUCATIONAL USE ONLY.

This is the original map area, a MasterMap map showing some large farm buildings to the left of the original farm house. If you had some information about how the area looked prior to their construction you could recreate a map form the past.

Farm replaced by grass.
© Crown copyright/database right 2010. Ordnance Survey/EDINA supplied service. FOR EDUCATIONAL USE ONLY.


The map on the right shows the area after a large green polygon has been drawn over the building area.  Make sure you select an appropriate line width and style for the map, and remember to set the opacity to maximum. You needn’t stop there though, you could add buildings on top of the green polygon representing those that had existed previously.


You can also use the annotation tools for some other neat tricks.  The image below shows how you can trace around existing features, a car park in this case, and use the measurement tool to work out its area. By making the polygon fully transparent you can then print out your result without obscuring the original features.

Car park with an area measurement.
© Crown copyright/database right 2010. Ordnance Survey/EDINA supplied service. FOR EDUCATIONAL USE ONLY.

Finally you can use multiple lines and polygons, annotated with text to build up complex new features on the map. The example below shows a proposed new airport in the Thames Estuary:

Before
Before
after
After

New Annotation Tools: Coming Soon

EDINA has been busy over these last few months creating some significant new features for Digimap Roam. To go along with the measurement tools we added at the beginning of April we are now working on some annotation tools.

Annotations ToolbarThese tools will allow you to draw symbols, lines and polygons on the map; add text, labels and area values; and set the colour and style of the features you have added. The features you add remain the same geographical size when zooming in and out and you can include them on your PDF print maps.

Annotations in use
Final version may differ from the image shown above.

You can download a sample PDF map here: Sample Annotations

We hope to have the annotation tools added soon, please keep checking the blog or the Digimap Facebook page for further announcements.