Jackie and Charlie’s statistics collaboration (a Flash-to-HTML5 challenge story)
Overview
Jackie Aim and Charlie Chu from the Interactive Content team talk about collaborating in the office (IRL) on a high-priority, complicated HTML5 statistics interactive for the College of Medicine & Veterinary Medicine (CMVM).
Jackie
As part of a bigger migration project for CMVM we have been converting bespoke Flash quizzes and interactives from around 2001 over to HTML5. The goal was to convert the Flash version to HTML5 and retain the look and function of the original. Student volunteers had already converted the majority using H5P where it was achievable. But there were always going to be a few which weren’t so straightforward and didn’t fit with any standard H5P templates.
I ended up recreating around 15 of these more complex interactives using Tumult Hype and Adobe Animate. The reason for using both is I really like using Hype and Animate has built in components, some of the older Flash objects had drop-downs and text entry fields so it made sense to look at this as an option. It was the first-time using Animate, but the interface was very familiar to me, it is basically Flash. Converting a Flash ActionScript 2 (AS2) confidence interval calculator to HTML5 was never going to be straightforward for me. It involved statistical maths and complex JavaScript neither of which I’m an expert in. Although I created a lot of the original Flash interactives, I did not do this particular one.
The original confidence interval calculator loaded Fusion Charts for the graph and had lots of AS2 code, AS2 seems a lifetime ago. I looked at using Chart.js to replace the Fusion one and also had a look at Google Charts. I spent a lot of time looking at the charts and the Adobe Animate community board. The Animate community board is such a nightmare to search through, just when you think you have found something the solution still requires ActionScript which is obviously of no use.
I did find one reference to Chart.js on the Animate community board. I tried to follow the instructions on how to add it to Animate but didn’t fully understand the explanation, I guessed it was possible but just not by me. I finally came to the conclusion that I wasn’t able to manipulate the chart to do what was needed either, it was just too complicated. So, I started thinking about animating it instead, so creating animations for the bars.
What I didn’t know was how to write the JavaScript to work out the calculations to run the animation. Also, an unexpected issue that transpired was that the Animate components displayed very small on a MacBook Retina display. So I knew I would have to write some css for these as well. I did get the CSS to work locally but not when uploaded to its final hosting location. Luckily help was on hand for both these issues…
Charlie
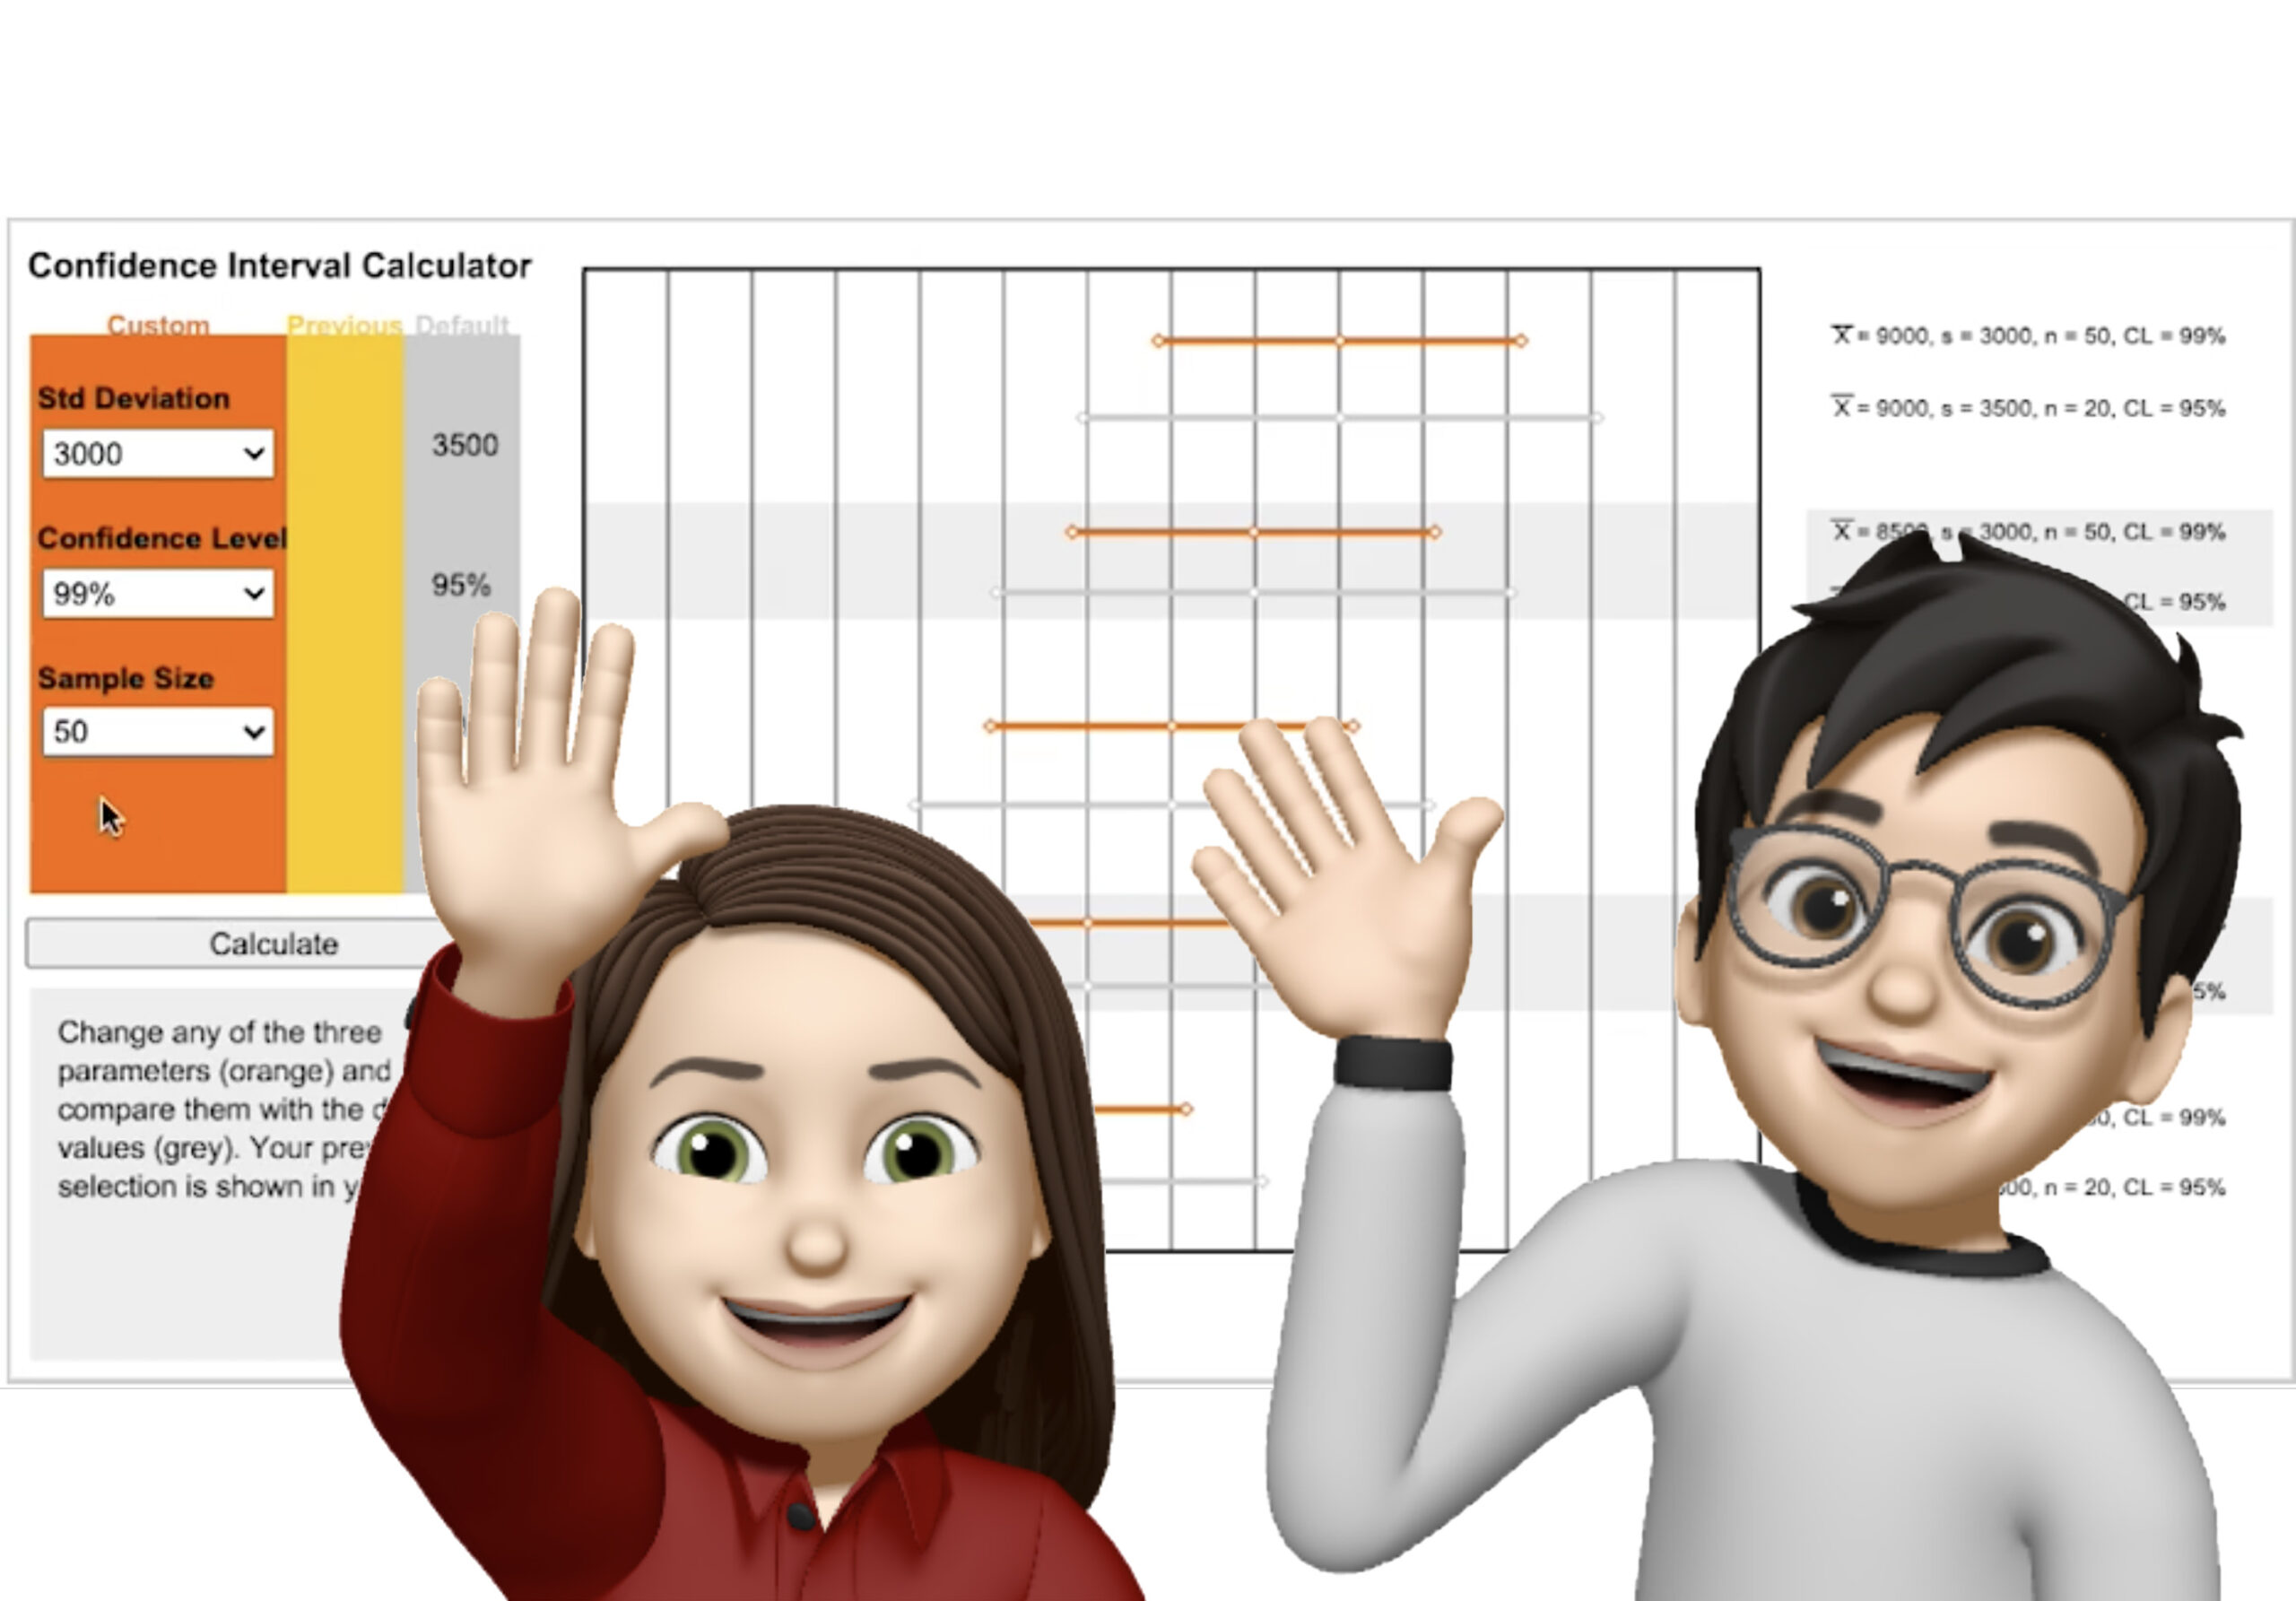
When I heard the difficulties encountered on remaking the old-fashioned Flash interaction from Jackie, I was a bit nervous on doing that as I was not an expert on Flash. But after familiarising myself with the original Flash object, I came up an idea on making use of the animation concept in Animate instead of going too deep with Chart.js.
In Animate, we could make an animation by using two keyframes (i.e. the starting & ending frames). The in-between motion would be then generated by Animate automatically, and furthermore, we could target the frame by using JavaScript. As a result, we could make the starting frame to stop at our desired minimum length of bar while the ending frame would stop at our desired maximum length of bar. But how could we map the confidence interval value to the frame in Animate in order to display the closest length of bar on the graph?
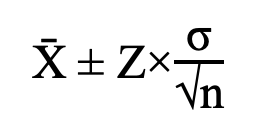
Confidence interval calculation
From the formula on calculating the confidence interval, we created a mapping table by using all parameters that a user could control (i.e. Z-value the chosen confidence level, σ the population standard deviation and n the sample size). There were 75 combinations altogether, and we needed to normalise all the calculated values from 1 to 100, and that would be the targeted frame number we could use for displaying the closest length of bar on the graph.
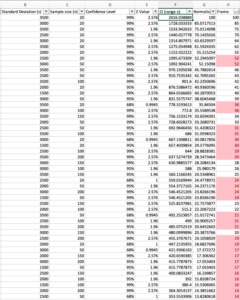
Spreadsheet screenshot showing confidence interval calculations for 100 frames
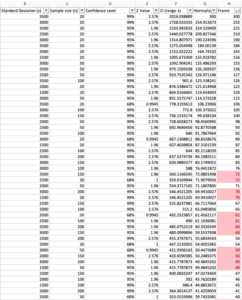
Spreadsheet screenshot showing confidence interval calculations for 300 frames
I am sure enough that you may observe that there are some duplicated frames (marked in red in the screen-shot above) that are now mapping to a different calculated confidence interval value. What that means was a same length bar will be displayed to user even though the calculated interval value was not the same at all. Therefore, by extending the maximum frames between the animation (i.e. increasing the ending frame to 300), the chance of having a duplicated frame would be minimised.
When comparing the migrated one with the original Flash, the new one just performed exactly the same. I am so glad to see my idea works smoothly on the migration task.
Conclusion (Jackie & Charlie)
When collaborating initially using MS Teams, it is quite efficient to understand the whole idea of the migration and the challenges of the task. We can brain-storm or work out a prototype for a possible solution individually.
However, when we want some feedback or comments on our testing, it might become difficult as we need to send the files and make sure we are in the same file version. Coming together in the office helped us to do things in the right order and share any feedback or comments whenever we like.
Demo video (finished interactive)
This short video gives demonstrates how the completed confidence interval calculator interactive works. This Animate file is now embedded within the medical statistics course (CAL) hosted on our new Pathways platform (successor to Labyrinth).


Hi Jackie, This sounds like an exciting creative project. Designing and animating custom stick figures from scratch is not that…
This is fascinating, particularly the idea of "coding without writing a single line." It really highlights the potential of prompt…
N.B. Closing date now extended to 23:59 on Wednesday, 4th of March.
Thanks Stewart for your encouragement!
Thank you Miki. I very much enjoyed reading this with my morning coffee. It was lovely to have such a…