New Ordnance Survey Digimap Licence Agreement

We are pleased to announce that a new Ordnance Survey licence agreement for Digimap is now available.

The new End User Licence Agreement (EULA) can be viewed in the Digimap Help Pages. As part of the new licence arrangements, end users need to agree to the EULA to access the Ordnance Survey data through the Digimap Service. Initially this will need to be done every time you access the collection via a popup after you select an application, however we are working on a new registration system that will mean you only need to do this once.

There is also an updated list of FAQs for the licence.

However, if you have any questions relating to the licence please do not hesitate to contact the Digimap support team.

  • Email: edina@ed.ac.uk
  • Phone: 0131 650 3302

What’s changed in the new agreement?

See below for key changes. Supplementary information is available from the EULA, the Ordnance Survey website and the EDINA helpdesk.

1. The following new products have been introduced to the Digimap Ordnance Survey collection under the new licence:

  • OS MasterMap® Integrated Transport Network Layer™ (ITN) Layer Urban Paths Theme.
  • OS MasterMap® Topography Layer will also contain the Sites Layer.
  • OS Terrain® 5, introduced as the new high resolution height dataset, replacing Land-Form PROFILE®.
  • PointX Points of Interest (PoI).

These will be made available through the Digimap service as soon as possible.

2. Changes to image publication size restrictions for external use

Image publication size restrictions have changed significantly with many being removed. Please refer to the Your Obligation/Restrictions section of the EULA, specifically Clause 5.1.4 and 5.2.

3. Public sector data sharing rights

In certain situations, it is now possible for you to share Digimap Ordnance Survey data with government departments and for government departments to share their Ordnance Survey data with you. For further details please see FAQs 27 & 28 in Licence FAQ section and consult the EULA Clause 4.

4. Authorised Data Handler

Where a Digimap Authorised User needs to use Ordnance Survey data in a secure data service, the new Digimap Licence now permits that via a separate Digimap Data Handler Agreement. Please see EULA Clause 3.1.4.

5. Educational navigation product/service

For Educational Use, you are now permitted to build Educational navigation apps. See the EULA, Clause 3.4 for the scope of what is permitted.

6. Use of YouTube and Twitter

You may now publish Ordnance Survey data, in line with strict terms detailed in EULA Clause 5, on YouTube and Twitter.

7. There is a change in the copyright notice that must be included on any maps

You must include the following acknowledgements on any display or reproduction of the Ordnance Survey Licensed data:

© Crown Copyright and Database Right [insert date]. Ordnance Survey (Digimap Licence)

Where the date to be inserted should be the current year.


For HE institutions:

If you are responsible for your HE institution subscribing to Digimap Ordnance Survey Collection you should already have received an email from Jisc Collections detailing how your institution can agree to the new Sub-Licence. Full details can be found on the Jisc Collections website.


If you have any further questions then please contact the Digimap Support team:

  • Email: edina@ed.ac.uk
  • Phone: 0131 650 3302


Ordnance Survey Maps Updated: September 2014

Even though we update our mapping data throughout the year we still make a large number of changes over the summer.

Along with the general updates to MasterMap and a few other products the biggest change over the summer has been to swap the 1:10 000 Scale Raster maps to VectorMap Local Raster maps in Digimap Roam. Ordnance Survey have retired the 1:10 000 data, so we have removed it from the online maps, though you do still have a couple of options if you are a fan of the product:

  1. You can view the VectorMap Local data styled to look like the 1:10 000 maps at two zoom levels in Roam; remember that on the Map Content tab you can remove the contours for a very close representation of the mapping.
  2. We still make the 1:10 000 data available in Digimap’s Data Download interface, and will continue to do so for at least this academic year.

The table below details all of the latest changes we have made showing the currency dates of all Ordnance Survey datasets in Digimap.

Digimap Roam

Ordnance Survey product Data Currency Last updated in Roam
OS MasterMap® Topography Layer May 2014 July 2014
OS VectorMap® Local July 2014 September 2014
OS VectorMap® Local Raster July 2014 September 2014
1:25 000 Scale Colour Raster March 2014 March 2014
1:50 000 Scale Colour Raster June 2014 July 2014
Meridian™ 2 January 2014 March 2014
OS Terrain™ 50 July 2013 October 2013
OS VectorMap® District Raster September 2014 September 2014
Strategi® January 2014 March 2014
1:250 000 Scale Colour Raster June 2014 September 2014
MiniScale® January 2014 February 2014

Data Download

Ordnance Survey product Data Currency Last updated in Data Download
OS MasterMap® Integrated
Transport Network™ (ITN) Layer
May 2014 September 2014
OS MasterMap® Topography Layer May 2013 September 2014
OS MasterMap® Topography Layer Raster June 2013 October 2013
Backdrop Mapping
* 1:10 000 Scale Raster June 2013 October 2013
OS Street View® April 2014 April 2014
1:25 000 Scale Colour Raster March 2014 March 2014
OS VectorMap® Local Raster July 2014 September 2014
OS VectorMap® District Raster September 2014 September 2014
1:50 000 Scale Colour Raster June 2014 July 2014
1:250 000 Scale Colour Raster June 2014 June 2014
MiniScale® January 2014 January 2014
Land and Height Data
* Land-Form PROFILE® November 2009 September 2011
* Land-Form PROFILE® DTM November 2009 September 2011
OS Terrain™ 50 July 2014 September 2014
OS Terrain™ 50 DTM July 2014 September 2014
* Land-Form PANORAMA® November 1993 September 2011
* Land-Form PANORAMA ® DTM June 2006 September 2011
Vector Data
OS VectorMap® Local July 2014 September 2014
OS VectorMap® District September 2014 September 2014
Meridian™ 2 January 2014 February 2014
Strategi® January 2014 February 2014
Boundary and Location Data
Boundary-Line™ May 2014 May 2014
Code-Point® August 2014 September 2014
Code-Point® Open August 2014 September 2014
Code-Point® with polygons April 2014 July 2014
OS Locator™ May 2014 May 2014
1:50 000 Scale Gazetteer June 2014 June 2014

* Land-Form PANORAMA®, PROFILE® and 1:10 000 Scale Raster products have been withdrawn by Ordnance Survey and are no longer updated.

Other Updates

Remember there have also been substantial changes made to the Geology and Marine data holdings in recent months:

Please also note that there are a lot more formats available than before so you may not have to convert the data after you have downloaded it:

It is now easier to see which formats are available for the data product you are downloading and change it if you need to, this blog post shows you how:

Please let us know if you have any questions about the new data or any other changes and additions to the Digimap service

  • Email: edina@ed.ac.uk
  • Phone: 0131 650 3302


Digimap 2012-13 Print Maps & Data worth nearly £40 Million

Money and Calculator
Picture courtesy of Images_Of_Money

As part of our work to demonstrate the impact of Digimap, EDINA has calculated the commercial value of all the data downloaded and maps created for printing. We calculated the values per institution for the period August 2012 to May 2013 then totalled them; this came to approximately £39 .5 million.  This estimate is a conservative one as we reduce the quantity of data downloaded by 60% to account for duplication. When all the maps printed and data downloaded were included in the calculation (i.e assuming users would continue to take their own data and maps, and not share them) the value rises to nearly £71 million.

Digimap Data and Print map values from 2010 to 2013
Click to enlarge image.

We know that some data is downloaded multiple times within an institution, for example by the students in a class exercise or for specific study sites. We found that only 40% of the data taken from Digimap over a period of time was unique to an average institution. We believe that if institutions were paying commercial rates for their data it would be more likely that they would try to download it once and then circulate it to those who need it; for this reason the value calculations only include 40% of the total. However, there is considerable variation between institutions as to how much is unique; those that do more research or are smaller in size tend to have a greater proportion of unique downloads, so we have included the 100% figure as a ceiling value.

In total, over the past three academic years over £190 million (£100 million at 40%) worth of print maps and data has been served up from Digimap to subscribing institutions.

How the Costs are Calculated

Porportions of Digimap Collections Values
Click to enlarge image.

The costs used in our calculations for the data downloaded come from the data suppliers, and include any relevant multipliers or discounts made publicly available on their websites.

The data values are calculated on a per product / per institution basis, with the data preparation and licensing charges assigned only once per product, per institution. Many of the data collections are licensed based on the number of users who have access to the data; with increasing numbers of users a multiplier is applied to a base cost.  We applied the relevant multipliers based on the number of active registered users for each collection at an institution. SeaZone data is provided commercially through a third party website; we picked the closest match possible to the data we provide though this does have a lower cost, again making the estimates conservative.

We capped data values at the price it would cost to take national coverage of each product, making it impossible to charge more for any one product than it would to supply the entire dataset for use by the whole institution.

The values for the print maps (including saved images in Carto and Ancient Roam) are calculated by finding the cheapest available commercial map prints from websites such as eMapsite, NLS and FiND. These values are updated every time we calculate the values.

What We Didn’t Include

Digimap Screen Maps Made 2010 to 2013
Click to enlarge image.

No monetary values were assigned to the millions of screen maps that are produced from Digimap; we couldn’t find a comparable site! Also, the value calculated doesn’t take into account any of the support materials, training courses and help desk facilities that are all part of the Digimap service.

No OpenData downloads or maps created from OpenData are included in the calculation, despite the advantages of producing them from Digimap over other websites.

However the biggest saving that isn’t included in these value calculations is your time. We only charged the data supplier’s preparation and licensing costs once per product or order, in line with each companies policy. In reality there would be many orders occurring throughout an academic year as new research questions are raised. This all costs time, time which the data suppliers will charge for or that institutional staff would have to take to put in requests for data or to create and manage a repository for spatial data.

Digimap does all this work for its subscribers along with providing a high quality mapping interface, 24 hour access to expensive high quality data and maps.

Over the coming weeks we will be sending out each institution’s values to Digimap site representatives. If you are interested in the value of the maps and data your institution has been using then get in touch with them.  If you are unsure who your site representative is then please contact us:

  • email: edina@ed.ac.uk
  • phone: 0131 650 3302

GeoVation Innovation in Transport Event

Ordnance Survey would like the academic community to know that the next GeoVation event on “Collaboration and User Innovation in Transport” will take place at the Royal Society of Arts, in London on 24 September 2012.

GeoVation Innovation in Transport

The event is brought to you by GeoVation and supported by Ordnance Survey, the Ideas in Transit project, Department for Transport, Technology Strategy Board and SBRI.

Details:

With rapid developments in social media technology, smartphone apps, open data, and volunteered geographic information, in a context of doing more with less and doing that sustainably, ‘Collaboration and User Innovation in Transport’ considers:

* The barriers to collaboration and user innovation in transport and how they can be overcome.
* How can real users’ needs be identified and addressed?
* How can open data be used effectively?
* How can business, government, communities and academia collaborate to create real value in improving transport?
* Collaborative consumption, creation and resourcing.
* Creating shared value and business model innovation in transport.

These and other topics will be explored by leaders and pioneers in their field through: keynote speeches, quick fire Pecha Kucha-like presentations, exhibition, and lively, interactive discussion with you, the participating audience, followed by an evening networking programme.

A list of the speakers can be found here:

“Exciting Speakers at our Innovation in Transport Event”

Register for the event here:

Eventbrite: “GeoVation – Collaboration and User Innovation in Transport”

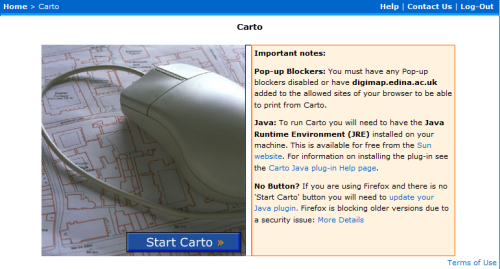
Carto not working in Mozilla Firefox?

Carto Start Page

If you use Mozilla’s Firefox as your browser then you may not be able to access Digimap’s Carto application.  The reason for this is that Mozilla is now (from the 30th August 2012) automatically blocking Java.  The reason that Mozilla has taken this stance is that a Java exploit has been added to the notorious Blackhole exploit toolkit.  In simple terms, running Java applications through your browser opens your machine up to hackers, and we dont want that.

We are working on Carto’s successor which we hope to launch in 2013 and this will not rely on Java.  If you need to use Carto, then it will still work in Internet Explorer and Chrome browsers. Hopefully Java will patch the breach soon and it will work again in Firefox.

For more information about this security issue please read this.

Digimap Ordnance Survey Data Annual Update

On the 13th of September we held the annual update of the maps and map data in Digimap. There haven’t been any major specification changes this time though you will notice some cartographic changes to the MiniScale maps in Digimap Roam.


New MiniScale Cartography
© Crown Copyright/database right 2011. An Ordnance Survey/EDINA supplied service.

The Urban areas are now purple and on the more zoomed out maps there has been some enhancement to the relief shading.

All the following data products were updated to the latest version available:

  • MasterMap Topography and ITN Layers:
  • Meridian2
  • Strategi
  • MiniScale
  • Code-Point
  • Code-Point with Polygons
  • Boundary Line
  • 1:250,000 Colour Raster
  • 1:50 000 Colour Raster
  • 1:25 000 Colour Raster
  • 1:10 000 Raster
  • 1:50 000 Scale Gazetteer

All the products have been updated in Digimap Roam, Carto and all the different Data Downloaders. The following products were not updated as the versions were already the most up-to-date available:

  • VectorMap District
  • VectorMap Local
  • Land-Form PANORAMA contours and DTM
  • Land-Form PROFILE contours and DTM


MasterMap Topo

Working with OS MasterMap

As lots of people are currently working on projects and dissertations we thought we’d share a few tips on using the OS MasterMap data from Digimap.

MasterMap TopoNOTE: MasterMap Download will be temporarily unavailable as part of the ‘At Risk’ period on Monday the 22nd of August.  It will also be unavailable for about an hour on either Wednesday 24th or Thursday the 25th of August as well.  This is to allow for some essential hardware maintenance on the server that houses the Database.  We are really sorry for any inconvenience this causes.

The MasterMap data available will be updated as part of our annual data refresh at the beginning of September.  If you need the 2010-2011s data then please order in advance of Monday the 22nd to ensure you don’t get caught up with the maintenance.


Downloading the Data

Remember that if you just want MasterMap as a background map you can use the 1:1000 or 1:2000 Raster versions of the data. This is available from the Data Download facility:

I just want some data

If you need the vector data for use in a GIS then you will need MasterMap Download:

How to use MasterMap Download

There is also a video on using  MasterMap Download:

[youtube width=”640″ height=”390″]http://www.youtube.com/watch?v=-G7mEYX4ikE&hd=1[/youtube]


Data Conversion

Once you have downloaded your MasterMap Data you will most likely need to convert it into a format that your GIS can use. There are three main options to do this, InterpOSe, OSM2MIF and Productivity Suite, see the following link for more information:

Getting MasterMap into a GIS or CAD


Other Help Resources

Using MapManager / Productivity Suite to convert MasterMap

Using MasterMap with MapInfo

Using MasterMap Data with AutoCAD:

[youtube width=”640″ height=”390″]http://www.youtube.com/watch?v=52UfIezk25M&hd=1[/youtube]

2011 Data Update

This year’s annual data update will take place at the beginning of September.  There will be a refresh the following Ordnance Survey products:

MasterMap Topo

  • MasterMap Topography and ITN Layers
  • VectorMap Local
  • Meridian2
  • Strategi
  • MiniScale
  • Code-Point
  • Code-Point with Polygons
  • Boundary Line

1:250,000 Colour Raster

  • 1:250,000 Colour Raster
  • 1:50 000 Colour Raster
  • 1:25 000 Colour Raster
  • 1:10 000 Raster
  • 1:50 000 Scale Gazetteer


There will also be updated Hydrospatial data in Marine Digimap and a new version of the DiGMapGB-50 data in Geology Digimap.

Along with the new data Ancient Roam will be getting the Annotation Tools and there may be a bit of a surprise bonus addition to Digimap Roam. More information will be posted on the Blog, Twitter and Facebook page nearer the time.

VectorMap Local now in Digimap Roam!

The VectorMap Local (VML) maps mentioned in the previous blog posts are now working in Digimap Roam. There is a video on YouTube showing you how to view all the different mapping styles that are now available at the four most zoomed in levels; including all the VML maps and Land-Line style MasterMap:

[youtube]http://www.youtube.com/watch?v=wadgUWe3jNA[/youtube]

For more informations see the previous blog post here:

More Improvements Coming Soon, June 20th 2011

More Improvements Coming Soon

We have had another very busy month and so a new batch of improvements for the Digimap services will be coming soon.

Printing in Ancient Roam

At the moment downloading data or saving screen images are the only ways to use the maps available in Historic Digimap once you have logged out.  Soon you will be able to create and save high quality PDF maps from Ancient Roam for use offline. We hope you will find this a much better way to get the best quality mapping out of the service.

Ancient Roam PDF
A sample image of what a PDF from Ancient Roam may look like.

New Data in Digimap Roam

Since the arrival of the Ordnance Survey’s latest large scale product, VectorMap Local,  we have been busy thinking of the best way to include it in the Digimap Roam. We have decided to use it to create four new representations available at two different scale levels.

Here is a quick look at what the four different representations might look like:

VML standard
Vectormap Local- Standard
VML Streetview
Vectormap Local - Streetview
VML Plan
Vectormap Local - Plan
VML Raster10k
Vectormap Local - 1:10,000 Raster

We haven’t stopped there either; we are also going to add in Line Drawing style mapping to the two most zoomed in levels; for those who like their MasterMap plain and simple, similar to planning application maps.

MasterMap - Plan
MasterMap - Line Drawing

You will be able to select the different views from the Map Content Control Tab using a drop down list.Alternate representations choice Menu

For more information about VectorMap Local look in the Digimap help pages as it is already available for download:

OS Products: OS VectorMap Local

Annotation Tools in Geology Roam

For those of you who have tried the annotation tools in Digimap Roam it will come as no surprise that we are very pleased to announce that we are now working on adding the same functionality in Geology Roam. Again the annotation tools are a first draft and will have exactly the same functionality as Digimap Roam’s tools.

Geology Annotation Tools

Once they are released we’d really like to hear from you about which functions you use and what else you would like added. We are already hoping to add in some Geology Mapping symbols for you to add to the maps.

As an added bonus we are also putting in the measurement tools so you can measure areas and distances too, so you can tell how long a fault is or what area is covered by different rock types.