Any views expressed within media held on this service are those of the contributors, should not be taken as approved or endorsed by the University, and do not necessarily reflect the views of the University in respect of any particular issue.
Digimap is an online map and data delivery service, available by subscription to UK Higher and Further Education establishments. Operated by EDINA at the University of Edinburgh, Digimap offers a number of data collections, including Ordnance Survey, historical, geological, aerial photography, LiDAR, marine maps, land cover mapping, global mapping and census data. For more information about Digimap go to our website: https://digimap.edina.ac.uk Background image Contains OS data (c) Crown Copyright and database right 2022
A number of datasets have recently been updated in Ordnance Survey Roam, the Digimap online mapping application, bringing them up to date with the most recent versions available from Ordnance Survey. All datasets are available to view using the Roam application in the Ordnance Survey collection.
The table below lists all the datasets that have been updated and includes the OS release date:
We are pleased to announce the release of DWG versions of both OS Terrain™ 5 (vector) and OS MasterMap® Topography Layer Building Height Attribute, which makes their use in CAD applications much easier and quicker.
Recently we have been working to produce DWG versions of the detailed vector dataset OS Terrain™ 5 and the popular Building Height Attribute component of OS MasterMap® Topography Layer. Both these datasets have proved popular with CAD users for detailed modelling applications but until now using them has proved time-consuming as many steps were required to convert them in to a format suitable for use in CAD applications.
OS Terrain 5 Vector
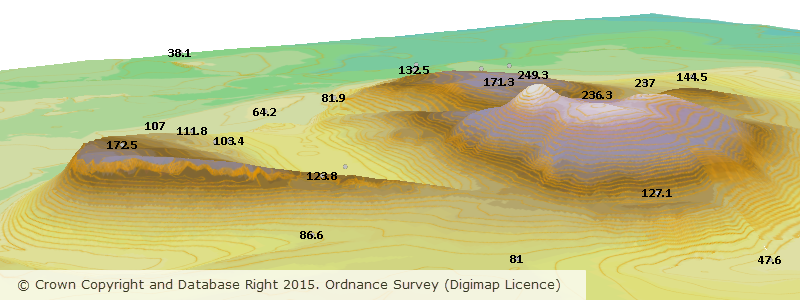
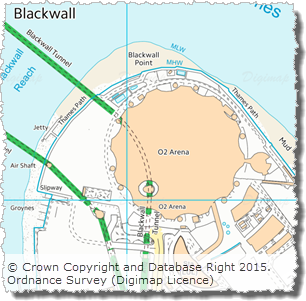
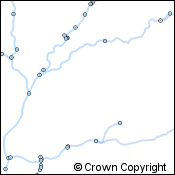
OS Terrain 5 Vector is dataset consisting of contour lines with five metre vertical spacing and spot heights (point features). The dataset also includes contours for mean high and low water around coastal areas, along with labels for both spot heights and contours. OS Terrain 5 is the most detailed height dataset available from Ordnance Survey. A Digital Terrain Model (DTM) version is also available in ASCII grid format and can be downloaded through Digimap.
Building Height Attribute (BHA)
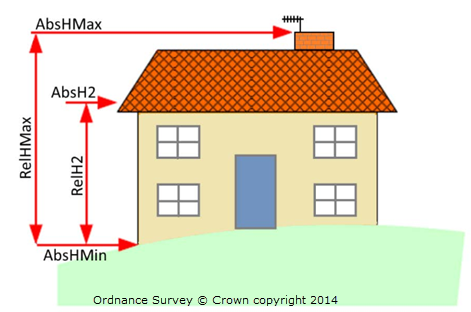
As with the other BHA datasets provided through Digimap the DWG version is supplied as a dataset of building polygons together with the building height attributes supplied by OS in the latest alpha release of their Building Height Attribute dataset (December 2014 at the time of writing). The DWG dataset is a 3D dataset which uses two of the height attributes supplied by OS to create the 3D features. The base height of buildings is set using the value of the AbsHMin attribute and the roof height is defined by the AbsH2 attribute:
All height attributes supplied by OS, as indicated in the image above, are included as XDATA which can be readily viewed in CAD applications.
Note: the DWG BHA dataset is not supplied with a terrain surface so the building features will appear to float above the surface if it is displayed without a suitable terrain surface. We recommend using either OS Terrain 5 or OS Terrain 50, both of which can be downloaded from Digimap.
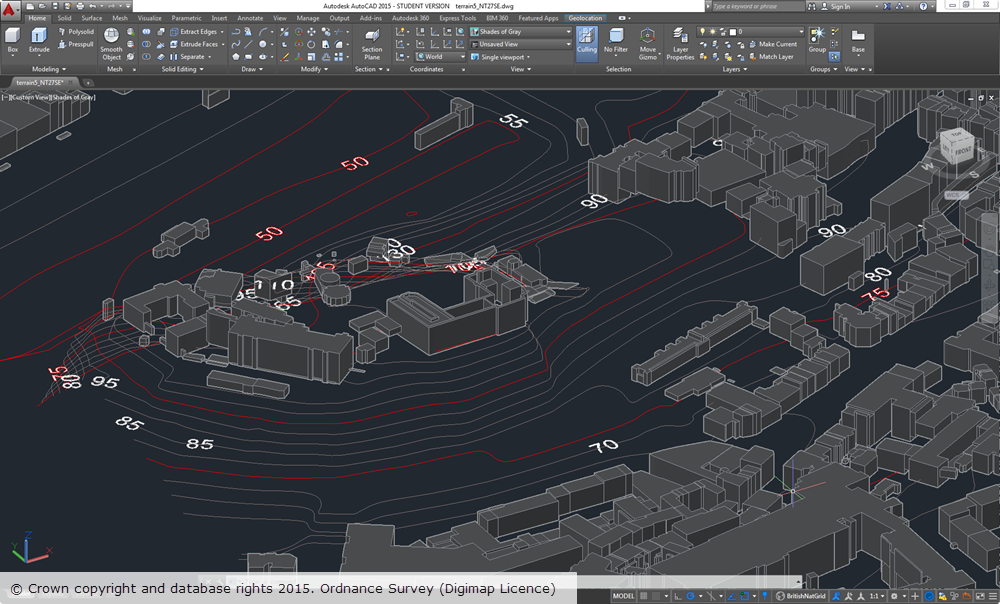
The image below shows OS Terrain 5 vector overlaid with BHA in AutoCAD 2015 for the area around Edinburgh Castle. Both datasets were supplied by Digimap in DWG format and required no manipulation or processing in order to display them.
OS Terrain 5 vector and OS MasterMap BHA datasets are supplied on a 5x5km grid, so you may receive multiple multiple files if your area covers more than one 5km grid square.
We hope this makes it much easier to use the data and we welcome any feedback you may have.
A number of datasets have been updated recently bringing them up to date with the most recent versions available from Ordnance Survey. All datasets are available to download using the Digimap Data Download application in the Ordnance Survey collection.
The table below lists all the datasets that have been updated and includes the OS release date:
Of particular note at this time is that Ordnance Survey have announced the withdrawal of the 1:50 000 Scale Gazetteer and OS Locator products following the release of OS Open Names in March 2015.
The last product update for 1:50 000 Scale Gazetteer will be June 2016.
The last product update for OS Locator will be May 2016
Following these releases Ordnance Survey will no longer supply, maintain or support the use of either OS Locator or 1:50 000 Scale Gazetteer.
If you have any questions about the dataset updates or Digimap please contact us:
The latest version of Ordnance Survey’s Boundary-Line data contains two new layers, Ceremonial Counties and Historical Counties.
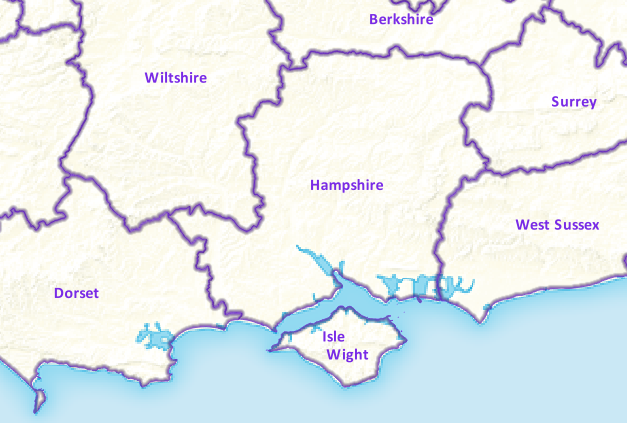
Ceremonial Counties
This new layer in the Boundary-Line data represents the areas of England, Scotland and Wales that are represented by a Lord Lieutenant. The Lord Lieutenant is the chief officer of the county and representative of the Crown; whenever the Queen visits an area she will be accompanied by the Lord Lieutenant.
This layer is very useful for those who want to make a map of Great Britain divided into its counties without all the complexities of Unitary Authorities, Districts and Boroughs. This is the layer to choose when making a map showing a more traditional view of Great Britain without making a historical view.
Historical Counties
The historic counties dataset shows the county boundaries in place in 1888 in England and Wales and 1899 in Scotland. The boundaries for England and Wales were derived from mapping from the National Archives dating from 1890. The Scottish boundaries are derived from maps as late as 1940.
This layer is very useful for those studying this time period and when combined with the ceremonial counties and modern the most up to date boundaries gives a good picture of how fluid the boundaries are over time.
Selecting Layers in Data Download
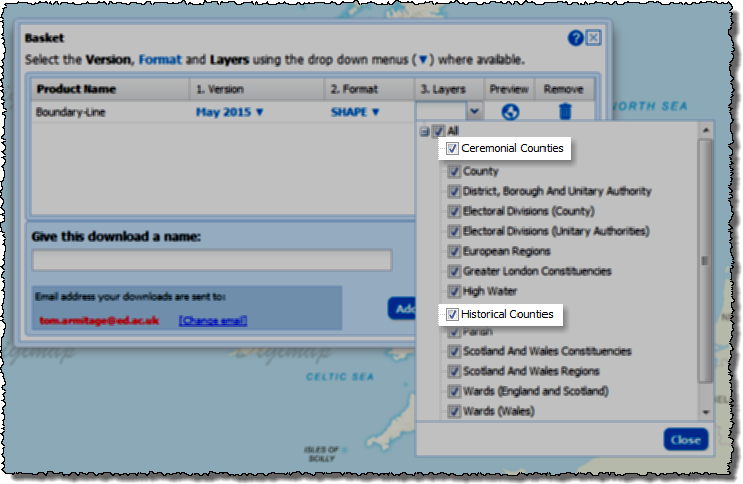
If you have the Boundary-Line data you need already but would like to add the new layers without downloading it all again then follow this useful tip. Once you have added the product to your basket click on the arrow in the layers column to pick and choose those that you want to take. See the image below:
You will then just receive these new layers and not all the others which you may already have or not need.
Please let us know if you have any questions about this or any other aspect of the service:
May has been a busy month for data updates in OS Data Download. Not only have we released Points of Interest, Urban Paths and MasterMap Sites Layer, but a number of other datasets have also been updated.
The latest version of Boundary-Line includes new datasets for Welsh Wards, Historical Counties, and Ceremonial Counties. Plus the data is now available in TAB format which is great news for MapInfo users. You can read more about these changes in this blog post.
The table below lists all the datasets that have been updated and includes the OS release date:
Ordnance Survey’s most detailed open data product, Open Map – Local, is now available to download from the Digimap service along with the OS Open Names gazetteer, OS Open Rivers water network and OS Open Roads road network. There are no restrictions on what the data can be used for, it just needs to carry a simple copyright acknowledgement:
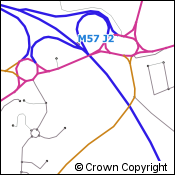
This is a vector dataset best viewed at a scale of 1:10,000, with layers including buildings, roads, sites, railways, hydrology, coastline, woodland and cartographic text. The data comes in Shapefile format for easy access in the most commonly used GIS software.
The data isn’t quite as feature rich as the licensed VectorMap Local data, though it does contain some nice additions such as the ability to highlight public buildings and their grounds.
OS Open Names
This is a gazetteer with 2.5 million entries, made up of over 870,000 named and numbered roads, nearly 44,000 settlements and over 1.6 million postcodes. This dataset is billed as the comprehensive list of Great Britain’s place names, road names and numbers and postcodes, and is certainly the most detailed gazetteer in Digimap. The data is available in CSV or GML formats.
OS Open Rivers
This is a generalised network view of the rivers of Great Britain. The data is designed to give its users a high-level view of where the water flows across the land surface. Though it doesn’t show the detail of the actual width or shape of the river as the topographic data it is a proper network. This means it doesn’t get interrupted by bridges or other features that prevent the topographic data from being used to “route” water through the river network. The data is available in Shapefile and GML formats.
OS Open Roads
Like OS Open Rivers this is a generalised network of roads. Topographic data will provide more detail about the road dimensions and real world position, however this data provides an uninterrupted network for road routing analysis. The data is available in Shapefile and GML formats.
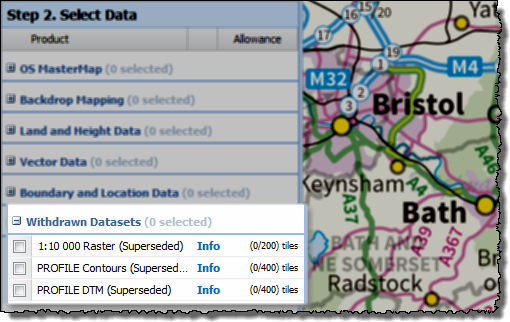
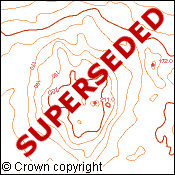
Ordnance Survey will withdraw two products in 2016, the 1:10 000 Raster data and the Land-Form PROFILE data. To remind you that these products will no longer be available from the Digimap service we are putting them in a new category in Data Download. The Withdrawn category will contain these datasets until we have to remove them from the site, March 2016 for the 1:10 000 Scale Raster and September 2016 for the Land-Form PROFILE contours and DTM.
Remember that the VectorMap Local Raster data is a more detailed generally better product to use than the 1:10 000 scale raster. If you really need the cartography of the old version, you can create a print map from Digimap Roam which styles the VectorMap Local data to look like the 1:10 000 Scale Raster. Just zoom in to the Street or Neighbourhood view levels and then use the Basemaps button at the top left of the map to change to the VML Raster 10k styling. An added advantage to doing this is that you can add in contour lines which were never available with the old data.
The Land-Form Profile data has also been superseded, you should now use the OS Terrain 5 data instead. Although it is not available in DXF format, Terrain 5 is a much improved dataset compared to the older data and it is still available in the following formats: GML, Shapefile (for the contours) and ASCII (for the DTM).
If you have any questions about the withdrawal of these datasets then please let us know:
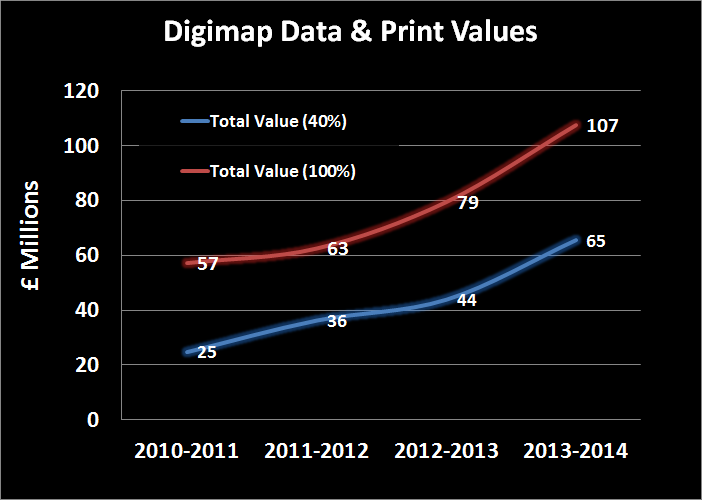
As part of our work to demonstrate the value for money of the Digimap Collections, EDINA has calculated the commercial cost of all the data downloaded and maps created for printing. We calculated the values per institution for the period August 2013 to July 2014 then totalled them; this came to approximately £65.4 million. This estimate is a conservative one because we reduce the quantity of data downloaded by 60% to account for duplication. When all the maps printed and data downloaded were included in the calculation (i.e assuming users would continue to take their own data and maps, and not share them) this total rises to over £107 million.
Click to enlarge image
We know that some data is downloaded multiple times within an institution, for example by students for a class exercise or by researchers for specific study sites. We found that on average only 40% of the data taken from Digimap over a period of time was unique within an institution. We believe that if institutions were paying commercial rates for their data they would be more likely to download it once and circulate it to those who need it; this is why we reduce the amount of data included in our calculation. However, there is considerable variation between institutions as to how much is unique; those that do more research or are smaller in size tend to have a greater proportion of unique downloads, so we calculated the 100% figure as a ceiling value.
In total, over the past four academic years over £306 million (£170 million at 40%) worth of print maps and data has been served up from Digimap to subscribing institutions. The steep increase in 2013-14 was caused by more Ordnance Survey products being downloaded and printed than ever before and also by the high commercial costs of several products added to the Geology Digimap service.
How the Costs are Calculated
Click to enlarge image
The costs used in our calculations for the data come from the list prices published by data suppliers, and include any relevant multipliers or discounts declared publicly on their websites.
The data costs we calculated are done on a per product / per institution basis, with the data preparation and licensing charges assigned only once per product, per institution (rather than per data request). Many of the data collections are commercially licensed based on the number of users who have access to the data; with increasing numbers of users a multiplier is applied to a base cost. We applied the relevant multipliers according to the number of active registered users for each Collection at an institution.
We capped data costs at the price of national coverage for each product, making it impossible to assign greater cost for any one product than it would be to supply the entire dataset for use by a whole institution.
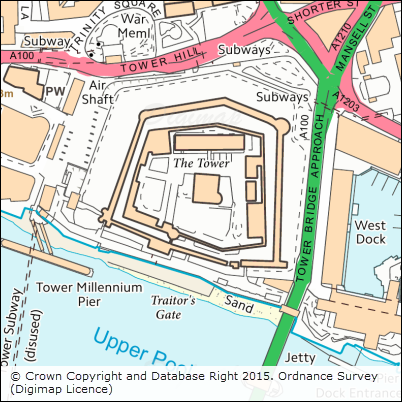
The values for the print maps (including saved maps in all Roam applications) are calculated by finding the cheapest commercially available map prints from websites such as eMapsite, NLS and FiND.
What We Didn’t Include
Click to enlarge image
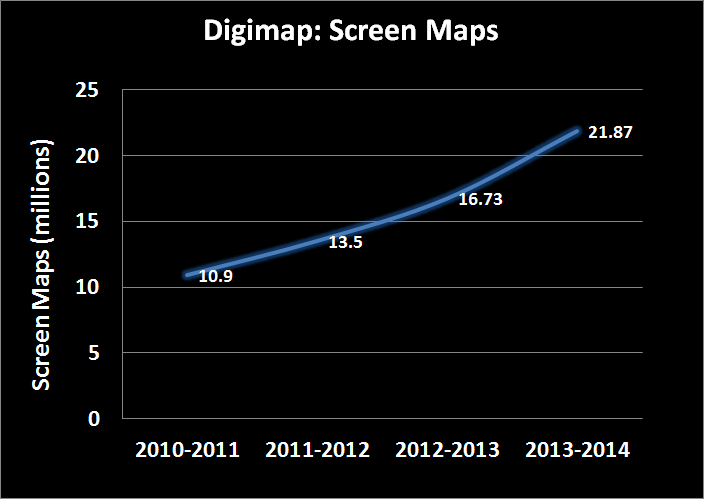
No monetary values were assigned to the millions of screen maps that are produced from Digimap. The value calculated also doesn’t take into account any of the help materials, training courses and support facilities that are all part of the Digimap service.
No OpenData downloads or maps created from OpenData are included in the calculation, despite the advantages of producing them from Digimap rather than other websites.
However, the biggest saving that isn’t included in these value calculations is your time. We only charged the data supplier’s preparation and licensing costs once per product or order, in line with each company’s policy where it applied. In reality there would be many orders occurring throughout an academic year as new research questions are raised. This all costs time, time which the data suppliers will charge for or that institutional staff would have to take to submit requests for data and time for staff to create and manage a repository for spatial data.
With 24 hour access to high quality data and maps through a purpose built mapping and data download interface, Digimap does all this work for its subscribers.
Over the coming weeks we will be sending out each institution’s data cost calculations to Digimap site representatives. If you are interested in the commercial costs of the maps and data your institution has been using please contact your site represenative. If you are unsure who your site representative is, please contact us:

 As well as releasing DWG versions of OS Terrain™ 5 (vector) and OS MasterMap® Topography Layer Building Height Attribute, a number of other datasets have been updated to the most recent versions available from Ordnance Survey. All datasets are available to download using the Digimap Data Download application in the Ordnance Survey collection.