Any views expressed within media held on this service are those of the contributors, should not be taken as approved or endorsed by the University, and do not necessarily reflect the views of the University in respect of any particular issue.
Digimap is an online map and data delivery service, available by subscription to UK Higher and Further Education establishments. Operated by EDINA at the University of Edinburgh, Digimap offers a number of data collections, including Ordnance Survey, historical, geological, aerial photography, LiDAR, marine maps, land cover mapping, global mapping and census data. For more information about Digimap go to our website: https://digimap.edina.ac.uk Background image Contains OS data (c) Crown Copyright and database right 2022
A number of datasets in the Ordnance Survey Collection have been updated in May this year. We’ve also made a number of improvements to some of the datasets that are popular for 3D modelling which will hopefully make it easier to use these datasets in CAD applications. The main changes are:
OS MasterMap Sites Layer now available in DWG and ESRI Shapefile format (previously it was only available in GML)
OS Terrain 5 DTM is now available in XYZ format for use in CAD applications
OS Terrain 5 Contours in DWG format are now provided as as 3D contours with the height of each feature set to the correct contour height
The data format help page has been updated to reflect these changes and is a good place to go if you are interested to see which datasets are available in a specific format.
The dataset updates are detailed in the tables below for OS Data Download and OS Roam:
OS Data Download:
Product Name
OS Publication Date
Boundary Line
May 2016
* OS Locator
May 2016
OS Terrain 5 Contours
April 2016
OS Terrain 5 DTM
April 2016
OS VectorMap Local Raster
April 2016
OS VectorMap Local
April 2016
OS Open Roads
May 2016
Code-Point Open
May 2016
* Note: this is the last update to OS Locator that will be supplied by Ordnance Survey who have announced that they are retiring this product. Users are advised to use OS Open Names instead. Whilst the data will still be available to download through Digimap, these products will no longer be updated to reflect changes in the real world.
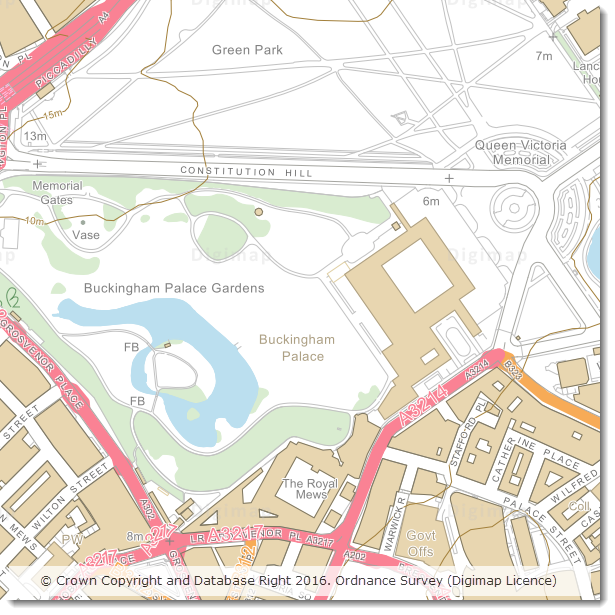
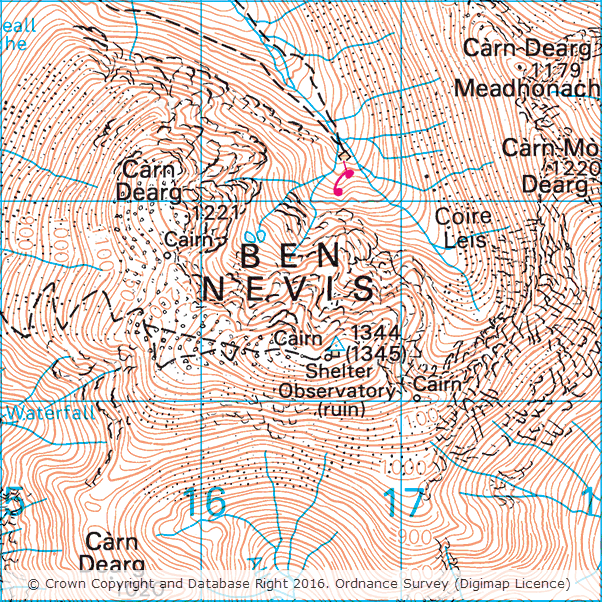
Lots of datasets were updated in March and April this year, with the majority of updates being to data in the Ordnance Survey Collection of Digimap. We also updated the vector marine data in Marine Roam so that it is now displaying the same version that is available for download through Marine Download; the Borehole data in Geology Download has also been updated to the latest version.
The updates include the latest versions of the 1:50,000 and 1:25,000 Colour Raster products which show the new height of Ben Nevis. The mountain, which is the tallest in Britain, was recently resurveyed by OS and found to be one metre taller than the measurements taken during the previous survey in 1949. If you’re interested in finding out more about the resurvey, and why two different heights are shown for the summit on the maps, the Ordnance Survey have published a blog post which explains the process in detail.
The tables below detail all the datasets that were updated recently in each Collection along with the publication dates of each one.
OS Data Download:
Product Name
OS Publication Date
1:25,000 Colour Raster
March 2016
1:50,000 Colour Raster
March 2016
MasterMap Topography Layer
January 2016
VectorMap Local
January 2016
VectorMap Local Raster
January 2016
VectorMap District
March 2016
VectorMap District Raster
March 2016
Terrain 5 Contours
January 2016
Terrain 5 DTM
January 2016
Code-Point with Polygons
January 2016 and April 2016
Code-Point
February 2016
Code-Point Open
February 2016
Points of Interest
March 2016
Open Names
March 2016
MiniScale
January 2016
* OS Street View
April 2016
* Meridian 2
July 2015 and January 2016
* Strategi
January 2016
OS Roam:
Product Name
OS Publication Date
1:25,000 Colour Raster
March 2016
1:50,000 Colour Raster
March 2016
MasterMap Topography Layer
January 2016
VectorMap Local
January 2016
VectorMap Local Raster
January 2016
VectorMap District Raster
March 2016
Terrain 50 Contours
July 2015
MiniScale
January 2016
* Meridian 2
January 2016
* Strategi
January 2016
* Note: these are the last updates to OS Street View, Merdian 2 and Strategi that will be supplied by Ordnance Survey who have announced that they are retiring these products. Whilst the data will still be available to download through Digimap, these products will no longer be updated to reflect changes in the real world.
As well as all the changes in the Ordnance Survey collection, we have also updated the vector data in Marine Roam from Seazone Solutions. This brings the data up to date with the latest version of the product from SeaZone Solutions, which is also available for download through Marine Download.
Product Name
SeaZone Publication Date
HydroSpatial One
August 2015
Geology Download:
Finally the Borehole data available in Geology Download has also been updated to the latest version available from the British Geological Survey.
Product Name
BGS Publication Date
Onshore Borehole Index
January 2016
If you have any questions about the dataset updates or Digimap please contact us:
Lots of datasets were updated in February this year in the Ordnance Survey Collection of Digimap. The tables below detail all the datasets that were updated last month along with the OS publication dates of each one.
OS Data Download:
Product Name
OS Publication Date
MasterMap Topography Layer
January 2016
VectorMap Local
January 2016
VectorMap Local Raster
January 2016
Terrain 5 Contours
January 2016
Terrain 5 DTM
January 2016
Code-Point with Polygons
January 2016
Code-Point
February 2016
Code-Point Open
February 2016
MiniScale
January 2016
* Meridian 2
July 2015 and January 2016
* Strategi
January 2016
OS Roam:
Product Name
OS Publication Date
MasterMap Topography Layer
January 2016
VectorMap Local
January 2016
VectorMap Local Raster
January 2016
Terrain 50 Contours
July 2015
MiniScale
January 2016
* Meridian 2
January 2016
* Strategi
January 2016
* Note: the January 2016 updates to Strategi and Meridian 2 are the last that will be provided by OS. The datasets will still be available to download through Digimap but they will no longer be updated to reflect changes in the landscape. Alternative products, which are still maintained by OS, are available including VectorMap District, 1:250,000 Colour Raster and MiniScale.
A number of datasets have been updated in January in both the Ordnance Survey and Marine collections.
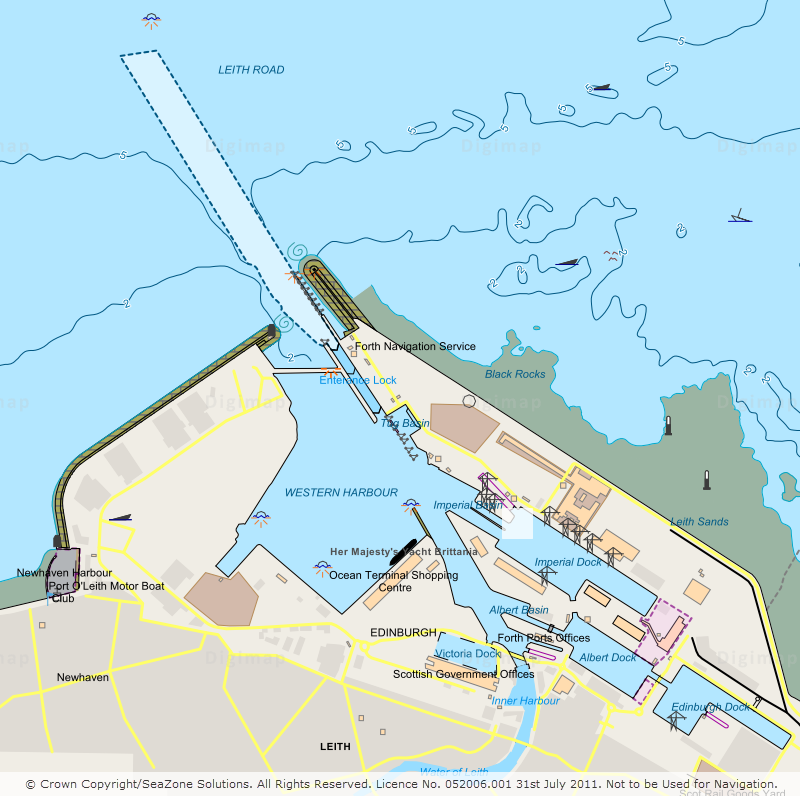
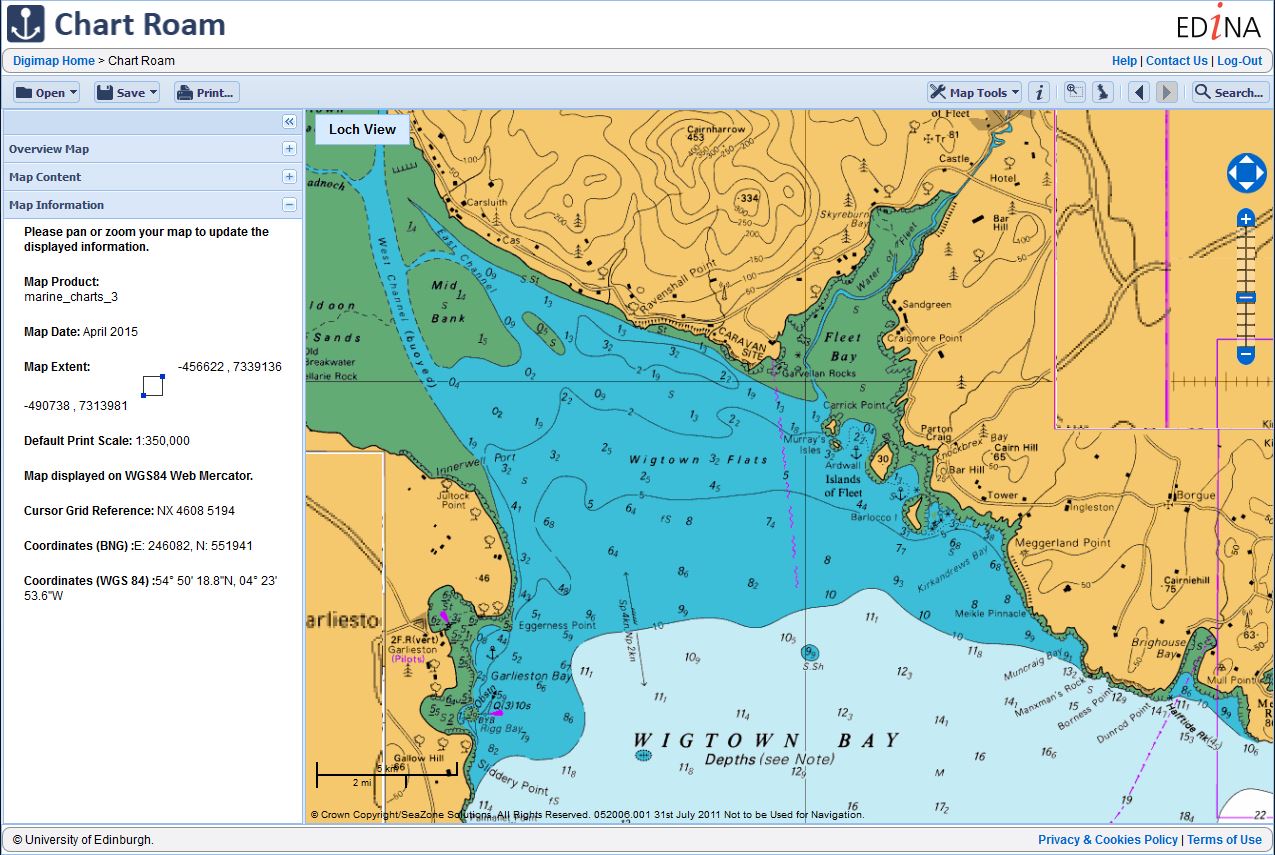
We reported back in December that the new ‘No Marginallia’ version of SeaZone HydroView Charts were available to download through Marine Download. Since releasing this new version we have seen nearly 15% of downloads now requesting the new ‘No Marginalia’ version, which is great to see. Hot on the heels of this we have now made this new version available in the new Chart Roam application, which replaced Marine Maps. The ‘No Marginalia’ version was ideal for use in Chart Roam as the removed map marginalia means the charts are ideal for use in the slippy map interface in Chart Roam.
The tables below lists all the datasets that have been updated in each collection together with the publishing date for each one.
Ordnance Survey Roam
Product Name
OS Publication Date
1:25,000 Scale Colour Raster
December 2015
1:50,000 Scale Colour Raster
December 2015
OS VectorMap® District
September 2015
Ordnance Survey Data Download
Product Name
OS Publication Date
1:25,000 Scale Colour Raster
December 2015
1:50,000 Scale Colour Raster
December 2015
Points of Interest
December 2015
OS Open Names
January 2015
Chart Roam
Product Name
SeaZone Publication Date
HydroView Charts
August 2015
If you have any questions about the dataset updates or Digimap please contact us:
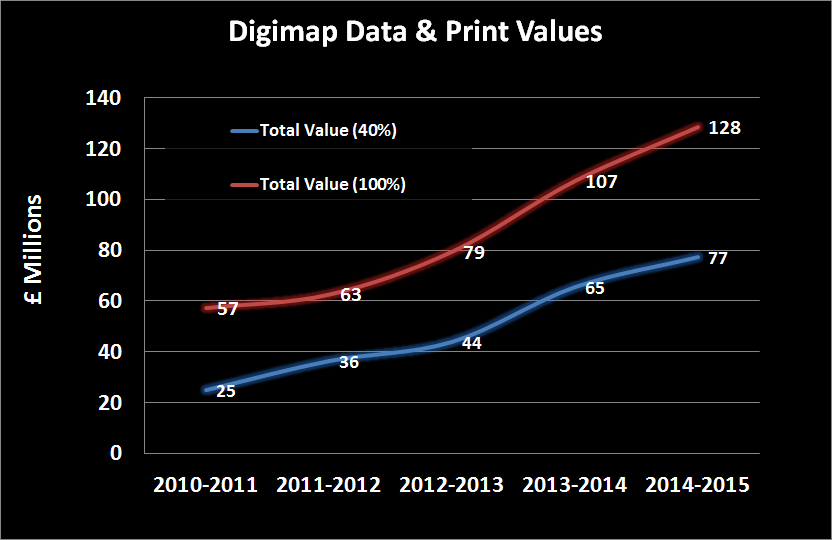
EDINA has again calculated the commercial cost of all the data downloaded and maps created for printing in all Digimap Collections for the period August 2014 to July 2015. This was done per subscribing institution and then totalled; the grand total is approximately £77.25 million. This estimate is a conservative one because we reduce the quantity of data downloaded by 60% to account for duplication of usage. When all the maps printed and data downloaded were included in the calculation (i.e assuming users would continue to take their own data and maps, and not share them) this total rises to almost £128.5 million.
Click to enlarge image
We know that some data is downloaded multiple times within an institution, for example by students during a class exercise or by individual researchers working on the same study site. We found that on average only 40% of the data taken from Digimap over a period of time was unique within an institution. We believe that if institutions were paying commercial rates for their data they would be more likely to download it once and circulate it to those who need it; this is why we reduce the amount of data included in our calculation. However, there is considerable variation between institutions as to how much is unique; those that do more research or are smaller in size tend to have a greater proportion of unique downloads (i.e. fewer people downloading the same areas, for example, for the same study site), so we have included the 100% figure as a ceiling value.
Click to enlarge image
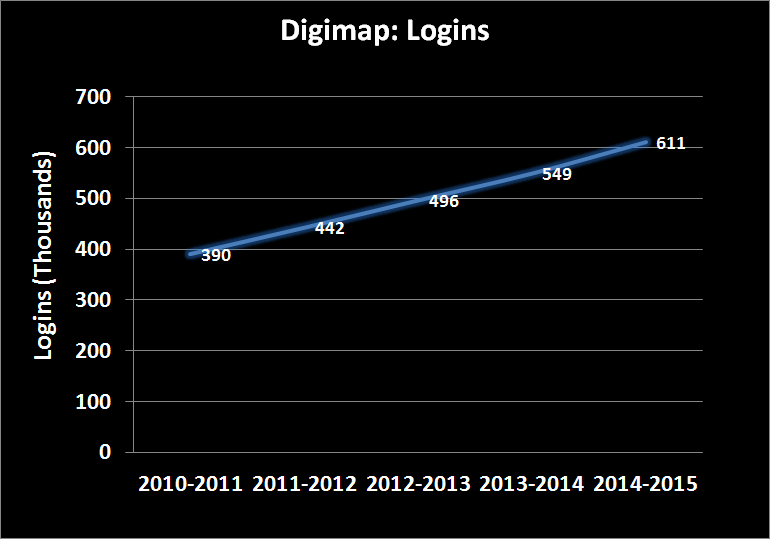
In total, over the past five academic years over £435 million (£248 million at 40%) worth of print maps and data has been served up from Digimap to subscribing institutions. The steep increase in 2013-14 was caused by more Ordnance Survey products being downloaded and printed than ever before and also by the high commercial costs of several products added to the Geology Digimap service. The upward trend in the total commercial costs has continued in 2014-15, though at a steadier rate, however we are seeing the same year on year growth in the number of logins to the service.
How the Costs are Calculated
Click to enlarge image
The costs used in our calculations for the data are sampled from the list prices published by a range of data suppliers, and include any relevant multipliers or discounts declared publicly on their websites.
Each data product is assessed individually because many are priced differently. The obvious example is OS MasterMap, which is charged on the basis of the TOID density per square kilometre. TOID density changes according to the area mapped. Each product is price-checked annually against a range of suppliers.
We calculate the values on a per product / per institution basis, with the data preparation and licensing charges assigned only once per product, per institution (rather than per data request). Many of the data collections are commercially licensed based on the number of users who have access to the data; with increasing numbers of users a multiplier is applied to a base cost. We applied the relevant multipliers according to the number of active registered users for each Collection at an institution.
We capped data costs at the price of national coverage for each product, making it impossible to assign greater cost for any one product than it would be to supply the entire dataset for use by a whole institution.
The values for the print maps (including saved maps in all Roam applications) are calculated by finding the cheapest commercially available map prints from websites such as eMapsite, NLS and FiND.
What We Didn’t Include
Click to enlarge image
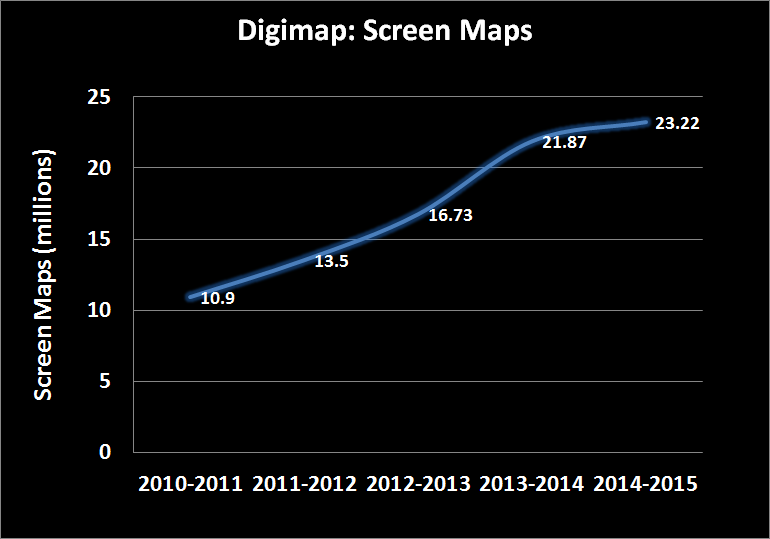
No monetary values were assigned to the millions of screen maps that are produced from Digimap. The value calculated also doesn’t take into account any of the help materials, training courses and support facilities that are all part of the Digimap service. Many commercial service providers may charge an additional fee for this part of the service.
All OpenData products (both prints and data downloads) are excluded from the calculation, despite the advantages of producing them from Digimap over other websites.
However, the biggest saving that isn’t included in these value calculations is your time. We only charged the data supplier’s preparation and licensing costs once per product or order, in line with each company’s policy where it applied. In reality there would be many orders occurring throughout an academic year as new research questions are raised. This all costs time, time spent submitting data requests and waiting for them to return; time to create and manage a repository for spatial data; time to acquire the knowledge on how to use the data you receive. Commercial providers mitigate these delays but may charge fees for the convenience. By providing 24 hour access to high quality data, customisable maps and detailed support materials through purpose built interfaces, Digimap saves this time and expense for its users.
Digimap avoids students, academics and support staff having to wait longer than necessary for the information they need and the instruction on how to use it.
We will be sending out each institution’s data cost calculations to Digimap site representatives. If you are interested in the commercial costs of the maps and data your institution has been using please contact your site representative. If you are unsure who your site representative is, please contact us:
A number of key datatsets have been updated in Digimap this December in several of the collections.
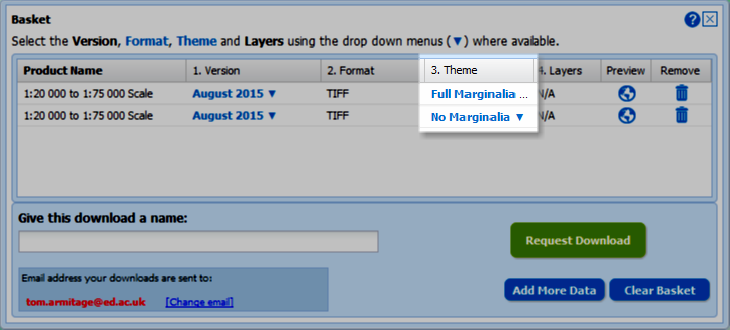
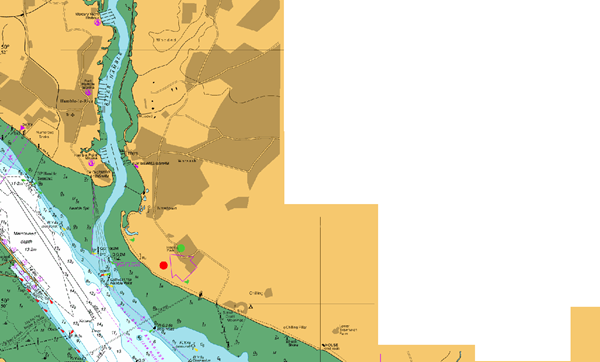
Of particular note are the updates to the Marine collection. The HydroView Charts raster product from SeaZone is now available in two versions: ‘Full Marginalia’ and ‘No Marginalia’. Users can select the version after adding the product to the basket in Marine Download.
The ‘No Marginalia’ version has all extra information round the map (e.g. north arrows, scale bars, inset maps etc.) removed and replaced with transparent areas. This makes it ideal for use in GIS software allowing you to pan across adjacent charts without this information obscuring the map data.
Furthermore the Charted Raster .tif files are now supplied with .tab files for accurate positioning in MapInfo.
The tables below lists all the datasets that have been updated in each collection together with the publishing date for each one.
Ordnance Survey Data Download
Product Name
OS Published Date
Boundary-Line
October 2015
Geology Download
Product Name
BGS Published Date
Boreholes
January 2015,
April 2015,
July 2015,
October 2015
Marine Download
Product Name
SeaZone Published Date
HydroSpatial One
August 2015
HydroView Charts (all scales)
August 2015
If you have any questions about the dataset updates or Digimap please contact us:
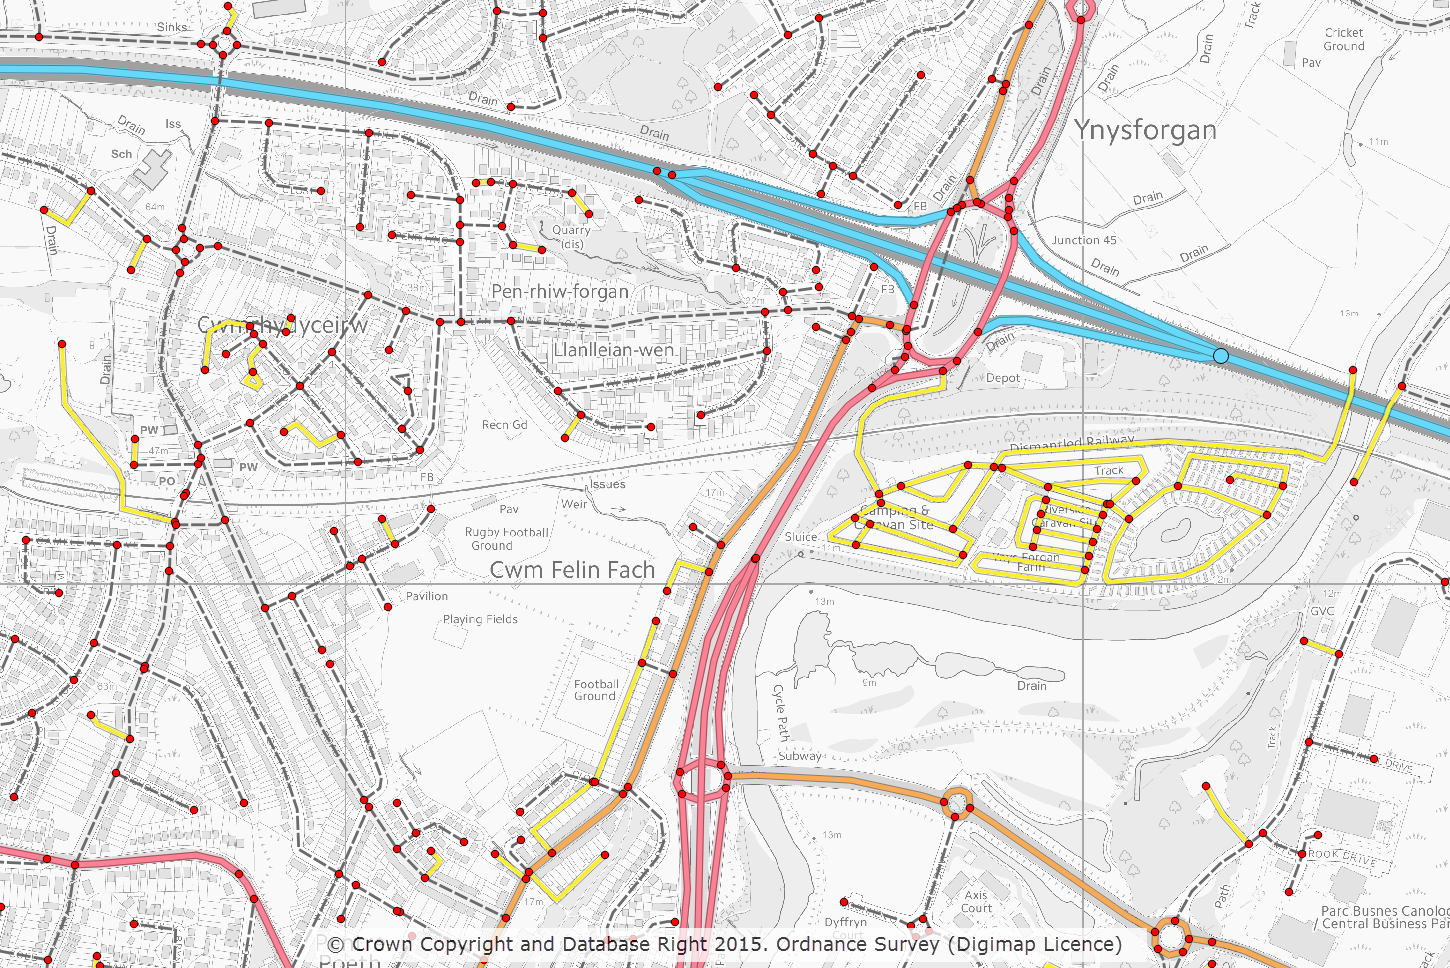
November has been a bumper month for updates in the Digimap Ordnance Survey Collection with updates to 15 of the datasets in the collection. Of particular note are the updates to two of the new Open Data products: OS Open Roads and OS Open Names. Both these products are still available as Beta versions as the products are still undergoing development by OS.
OS Open Roads on top of VectorMap Local Raster (displayed in greyscale using QGIS)
The tables below lists all the datasets that have been updated in the Digimap Ordnance Survey Roam and Data Download applications and include OS release dates for each one.
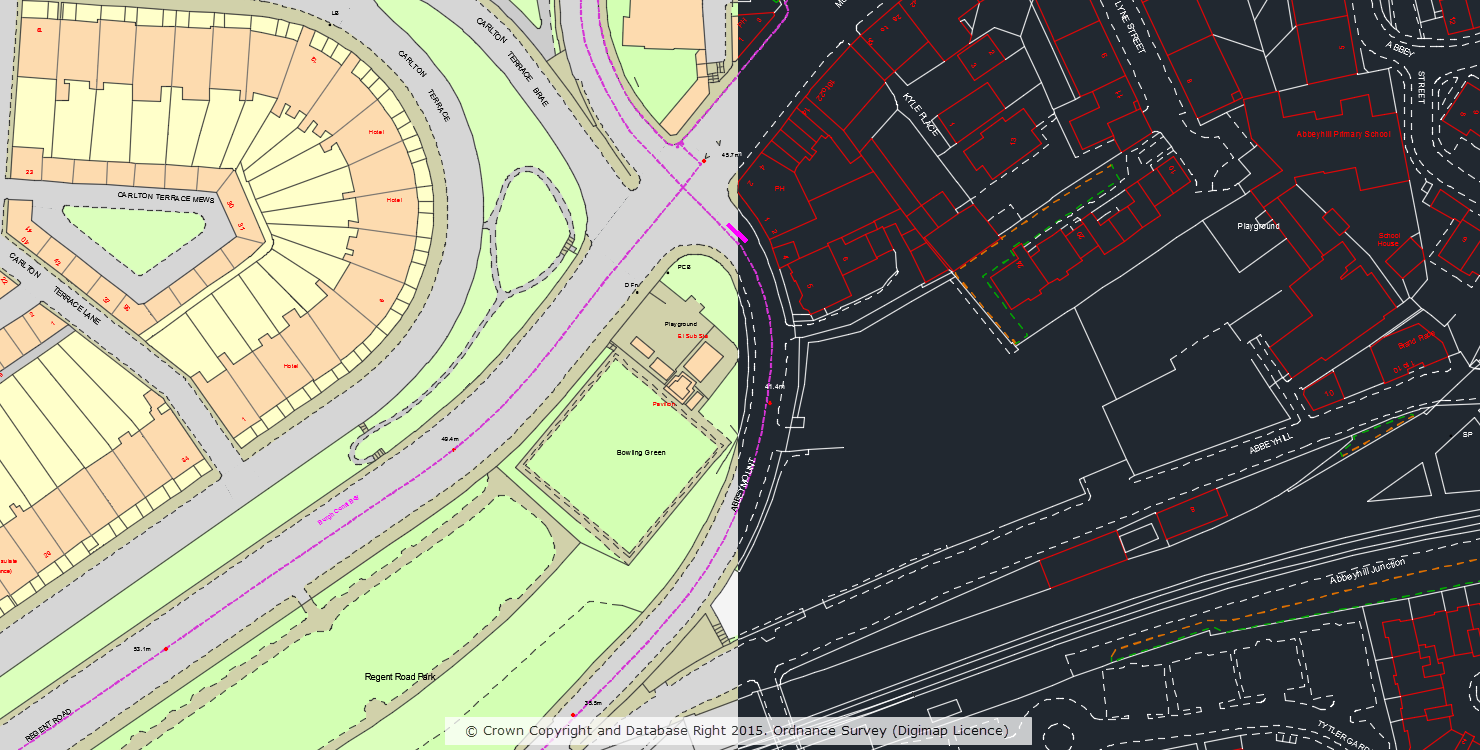
In April 2015 we made OS MasterMap Topography Layer data available to CAD users in DWG format. If you missed the announcement you can read all about it in this blog post. Since adding this option to Digimap we have processed over 13,000 orders for MasterMap in DWG format. Building on this we have now produced an outline ‘Plan’ style of MasterMap in DWG format which is a stripped down representation that mimics the alternative ‘Line Drawing’ style of MasterMap available in the Digimap Roam application.
OS MasterMap Topography Layer in standard and plan style
The alternative ‘Plan’ style is a cut down version of the full dataset and does not include polygons, users requiring the full dataset should download the original ‘Standard’ style which includes both lines and polygons.
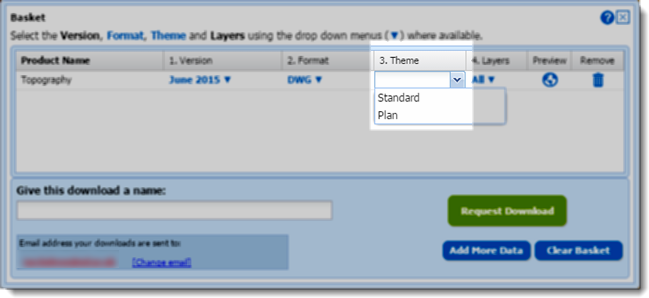
The style is specified in the basket window of the Data Download application using the drop-down in the ‘Theme’ column:
Selecting DWG plan style in the basket
We hope you find this new style useful, if you have any questions or suggestions for further improvements please contact us:
A number of datasets have been updated in the Digimap Ordnance Survey Collection in early October, bringing them up to date with the most recent versions available from Ordnance Survey.
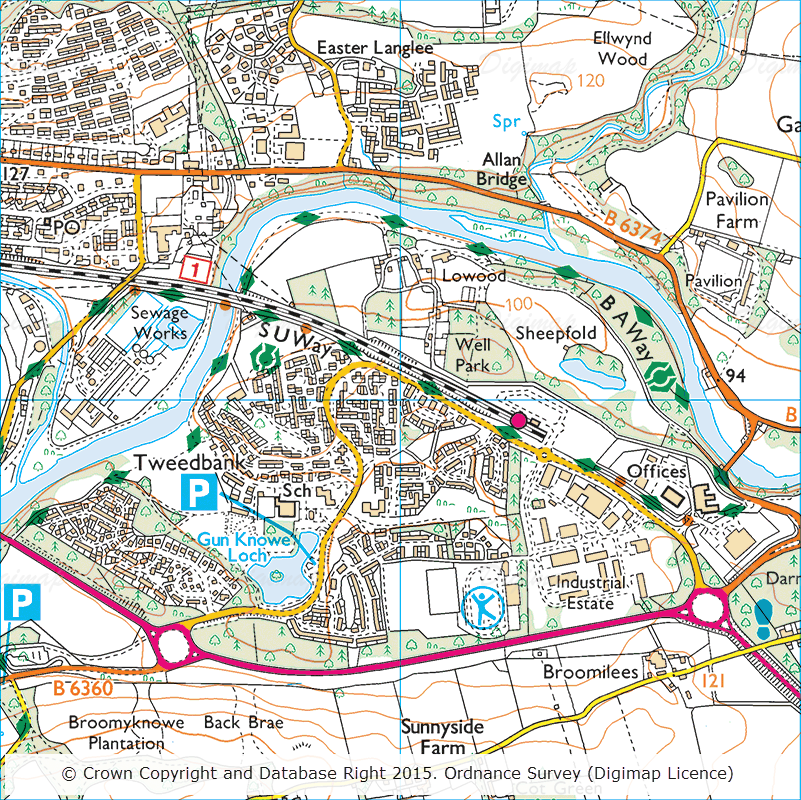
September 2015 OS 1:25,000 Colour Raster showing the new Tweedbank station at the southern end of the new Scottish Borders Railway
Ordnance Survey Roam
The table below lists all the datasets that have been updated in the Digimap Ordnance Survey Roam application and includes the OS release date:
Product Name
OS Release Date
1:25,000 Colour Raster
September 2015
1:50,000 Colour Raster
September 2015
OS VectorMap® District Raster
September 2015
Ordnance Survey Data Download
The table below lists the datasets that have been updated in the Digimap Ordnance Survey Data Download application and includes the OS release date:
Product Name
OS Release Date
1:25,000 Colour Raster
September 2015
1:50,000 Colour Raster
September 2015
OS VectorMap® District
September 2015
OS VectorMap® District Raster
September 2015
Points of Interest
September 2015
OS VectorMap® District has undergone a few significant changes with this update:
A new ‘Functional Sites’ layer is now included which includes features from the old ‘Airport’ and ‘Public Amenity’ layers plus additional information on education facilities – school and higher, medical care, road transport and police stations.
Land polygon(s) are no longer provided so if you wish to colour your land you can download a Shapefile from the OS website that covers the dataset extents and colour this. Full detailed instructions can be found in chapter 6 of the VectorMap District Product Guide published by OS.
As well as these significant changes, OS have made a number of smaller changes including increased detail of buildings and improved data accuracy. You can read about all the changes in this OS blog post and also in the September 2015 Release Notes published by OS to accompany this latest version of the data.
OS have updated the stylesheets to accommodate all these changes, the most recent versions of the stylesheets can be downloaded from the OS GitHub repository and are available for ArcGIS (for data in Shapefile format) and QGIS (for data in Shapefile and GML formats).
Scotland’s Greenspace Map is now available to download through the Data Download application in the Ordnance Survey Collection of Digimap.
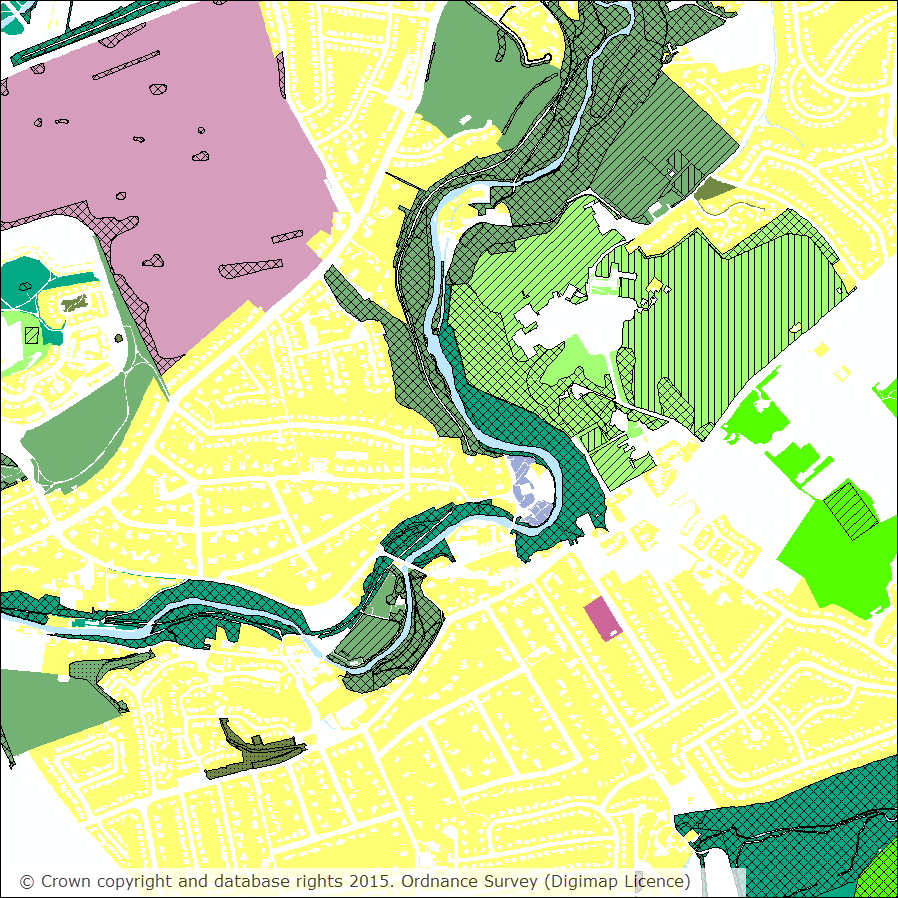
Scotland’s Greenspace Map, coastline taken from GB National Outlines from Ordnance Survey.
Scotland’s Greenspace Map provides information about the type and extent of greenspace in urban Scotland (i.e. towns and cities with a population of over 3000). It was compiled in 2011 from greenspace data provided by the 32 Scottish local authorities.
The dataset categorises greenspace into 23 different open space types (for example, public parks, private gardens, play areas, semi-natural, community gardens and allotments). These types are based on the Planning and Advice Note (PAN) 65 Planning and Open Space. Sometimes one area has more than one type of greenspace. For example, the main (primary) use of the area may be a public park, but within this, an area is used as a play area (secondary use). The primary use is shown as a block of colour and the secondary use is shown as an area of hatching.
Detailed map at 1:10,000 showing primary use (solid colours) with secondary use displayed on top using hatching.
The dataset is supplied in ShapeFile format with documentation and layer files to style the data in QGIS and ESRI’s ArcGIS. Layer files are provided for display at the following scales:
National (approx 1:2,500,000) – uses a solid colour to denote the presence of greenspace within a Local Authority.
1:50,000 – displayed using the broad 9 PAN65 typologies.
1:25,000 – displayed using the 23 greenspace primary land use categories.
1:15,000 – primary land use displayed as per 1:25,000 with a single category to show where a secondary use exists.
1:5,000 – primary land use displayed as per 1:25,000 with secondary use split up in to six categories.
Please note: Scotland’s Greenspace Map is produced by www.greenspacescotland.org.uk and not Ordnance Survey. However the dataset was created using OS MasterMap® Topography
Layer so it is subject to the same licence conditions as the other licensed Ordnance Survey datasets.