As many of you may be aware, the number of users of the Digimap service using CAD systems has increased considerably over the years. As this user base has grown we have endeavoured to make the data we provide as easy to use as possible in these systems. As part of this effort to continually improve the service we offer, we have made some considerable enhancements to the products we offer for use in CAD systems.
Part of the problem is that there is a proliferation of systems in use under the general banner of ‘CAD’ systems, including AutoCAD, Revit, Rhinoceros, Vectorworks to name a few. A common factor between these systems is that they can accept vector data in DWG format, however, the way that DWG data is handled can vary between systems.
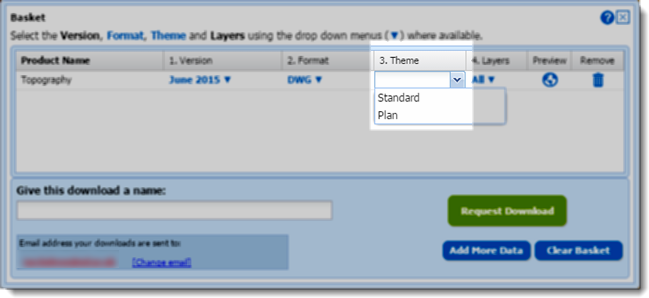
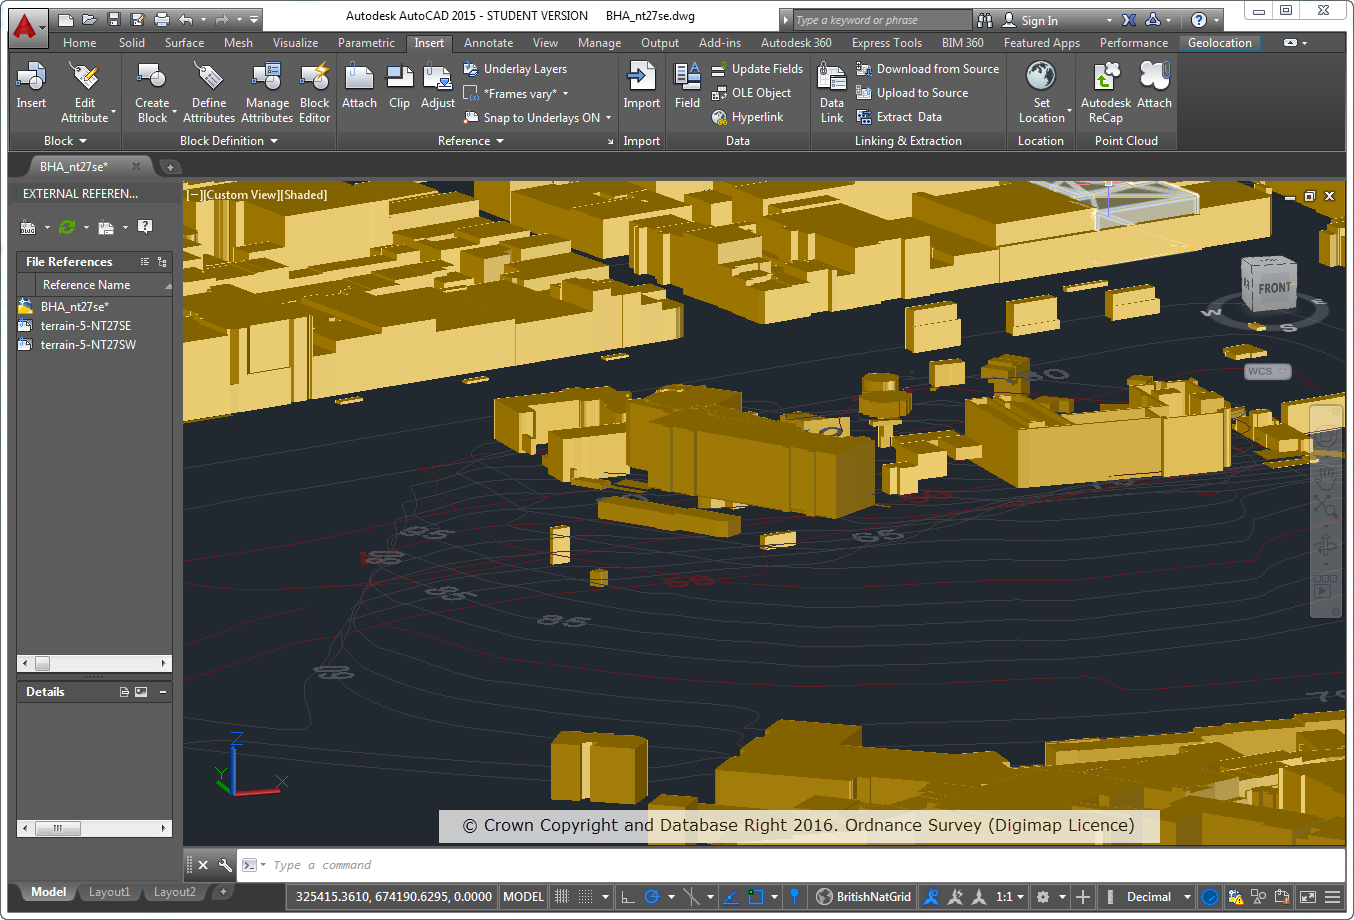
A number of our products in DWG format were loading into CAD systems but some were not correctly spatially referenced. This meant that although the data looked fine and worked perfectly well on its own, but it was difficult to overlay or integrate it with other datasets. We have now fixed this issue, so that it is possible to overlay common products together much more easily.
To accompany the DWG map data we also provide Digital Terrain Model (DTM) data to allow you to create a landsurface to loacte buildings and infrastructure on. In the past we only provided the OS Terrain 5 DTM in a format that was not so easily used in some CAD systems. To remedy this, we are now delivering OS Terrain 5 DTM in the XYZ format that can be used in most CAD systems.
These are the Changes we have made:
- All data available as DWG should overlay correctly where appropriate in AutoCAD Map 3D, AutoCAD, AutoCAD Civil, Revit and Rhinoceros.
- All data has the correct Spatial Reference (British National Grid) and Units (metres).
- OS Terrain 5 Contours are available as 3D Polyline data which is suitable for creating surfaces in Revit and Rhinoceros 5.
- OS Terrain 5 DTM is available in an XYZ format which can be used to create surfaces in AutoCAD and Rhinoceros 5.
- OS MasterMap Sites Layer is now available in DWG.
We have updated our help pages in line with these changes and recommend that you consult the AutoCAD FAQ page which has further details for how you can load Digimap data in to common CAD packages.
We hope our CAD users find these changes useful but if you have any questions about using Digimap data in a CAD system please let us know. Similarly if you can provide us with any information about using Digimap data in a CAD system we would be very pleased to hear from you.
- Phone: 0131 650 3302
- Email: edina@ed.ac.uk
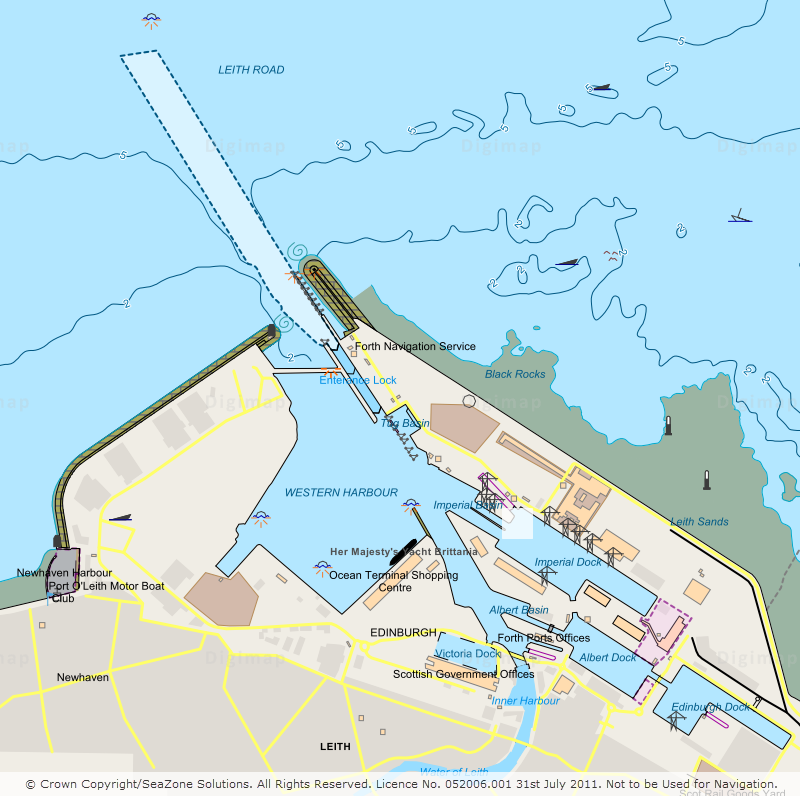
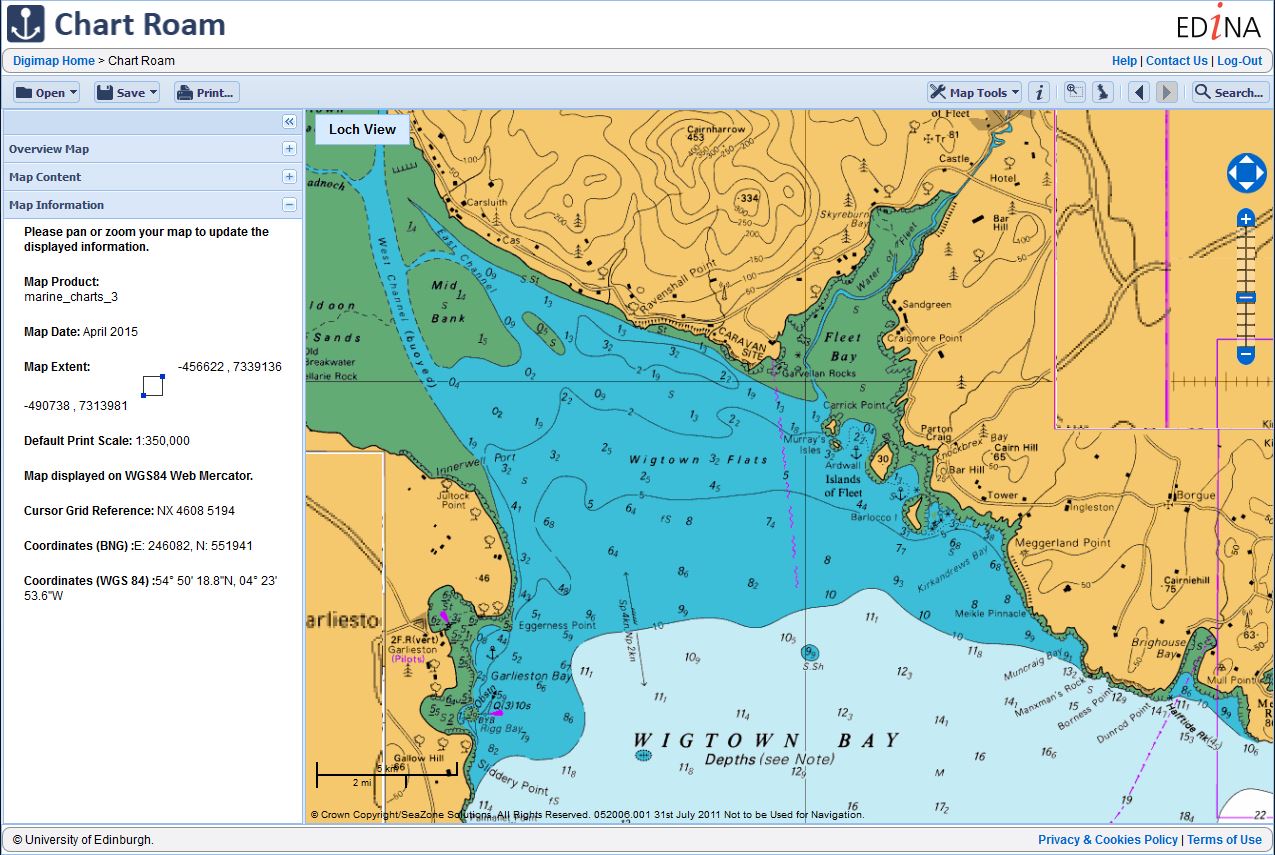
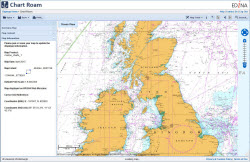
 Chart Roam displays marine Hydrographic Charts from