Since the addition of new print functions to Roam, it is now easier to print a map showing the whole of Great Britain.
[Click to enlarge]
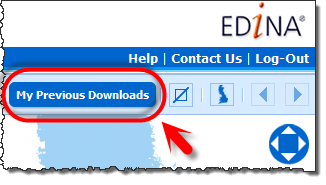
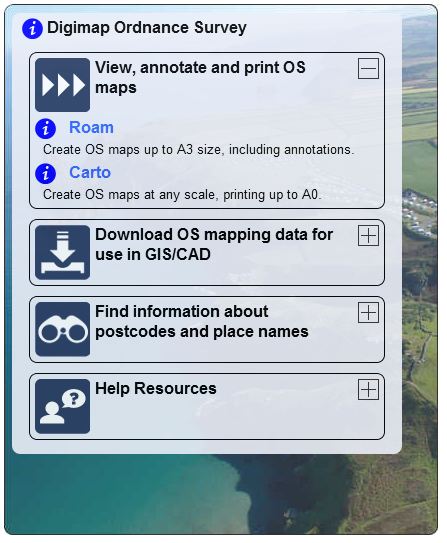
- Log in to Digimap and click on Roam in the Ordnance Survey Collection.
- Use the slider bar in the upper right corner of the map to zoom in once to show the National View. Don’t change the position of the map itself.
- Click the Print button on the top toolbar (top right hand corner)
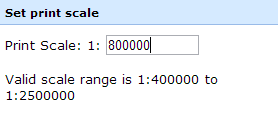
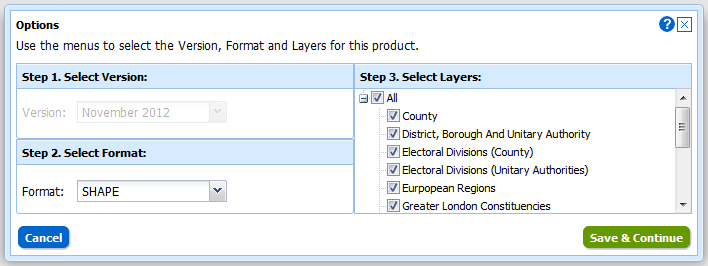
- Set the print scale to 1:1.1 million (1:1100000)
- Choose A0 portrait and an appropriate format from the drop-down lists (PDF will generate reasonably quickly)
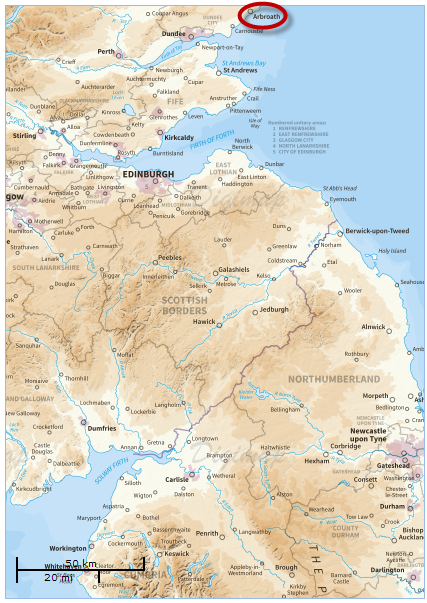
- Now click-and-drag the preview map directly upwards (north) so that Arbroath (shown on the east coast of Scotland) is at the very top edge of the preview map.
- Click Generate Print File
- The resultant file in PDF format will be around 2.9MB
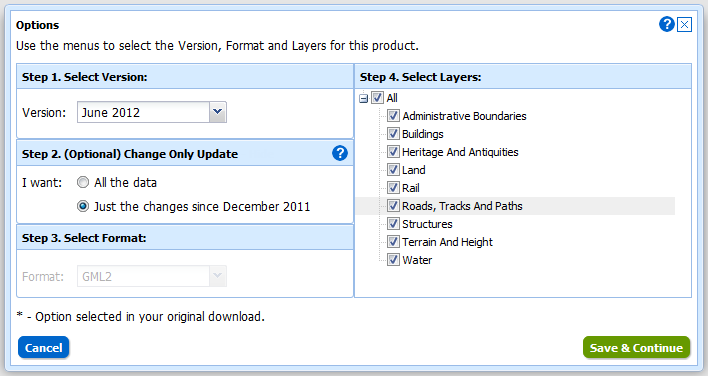
If you prefer to use a different map product, you could use the following variations on the above instructions:
[Click to enlarge]
- Zoom in twice on the map using the slider bar (to view the County View map). Again, don’t change the location of the map.
- In the print interface, set your scale to 1:1,100,000 and your paper size to A0 portrait, as previously
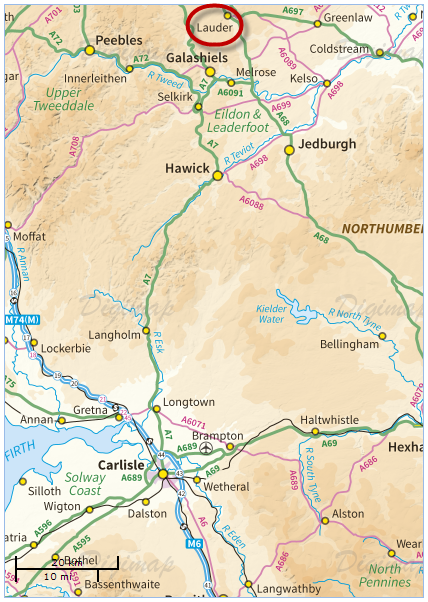
- Now drag the map northwards so that the town of Lauder sits just below the top edge of the preview map.
- This file in PDF format will be around 11MB
These instructions may need some minor alterations depending on your monitor resolution. You may find you need to drag the map either a little more or a little less further north in order to see both Shetland and the Scilly Isles on your printed map.