Green Web Platforms Intern, First 2 Weeks

How do we measure web service emissions?
is one of the questions that I have been hired to tackle. My name is Otis Laundon, and I’m the new Green Web Platforms Intern. My first 2 weeks in the office have been super enjoyable, from familiarising myself with our beloved Argyle House, to meeting some of our staff and the other interns, who are all lovely people.
In terms of what I’ve been working on so far, I have mostly been doing research into web sustainability. Specifically, what are the principles and standard practices for measuring and reporting emissions from web services. Here in ISG we support several online teaching platforms such as Learn, Media Hopper Replay, Media Hopper Create, and more. Though these services are all in “the cloud” it doesn’t mean that they stay afloat effortlessly. These services of course consume energy to run, and also require use of internet infrastructure, the use of which accounts for over 2% of annual global emissions.
Below is a snapshot of a flowchart documenting my understanding of the various sources of emissions associated with our online teaching platforms, as well as ways of potentially measuring them. It has been really useful for helping me understand the big picture of what’s going on with the different services. I have updated it over the last few days whilst reading documents such as The GHG Protocol ICT Sector Guidance and the Cloud Carbon Methodology. This is only a rough, messy, incomplete draft but at some point I will publish a more readable version to help others quickly get to grips with the complex nature of web sustainability.
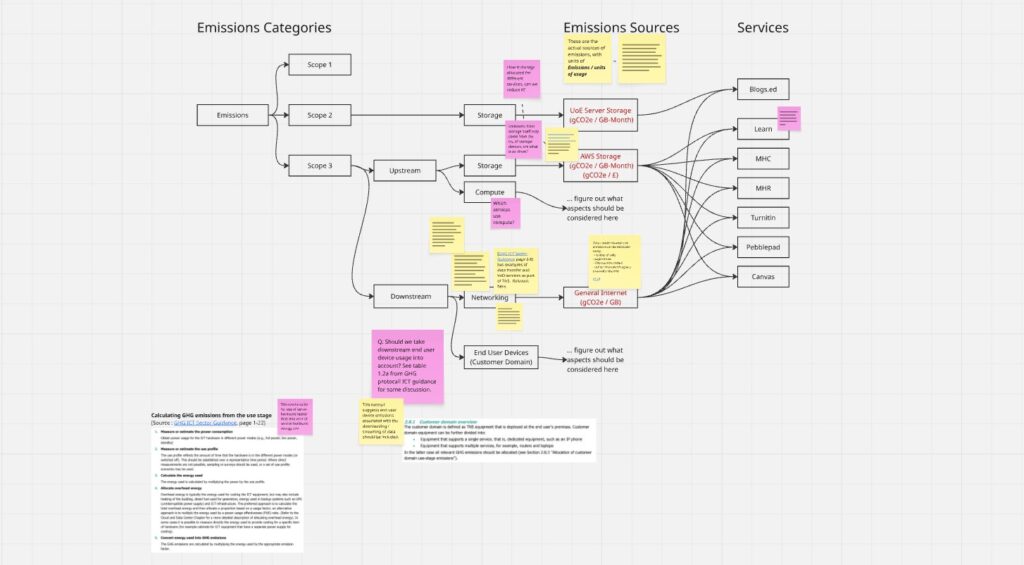
Breakdown of emissions from our various online teaching platforms.
I’ve already learned far more than I could fit into a blog post, but one key thing I have learned about so far is emissions scopes.
Carbon emissions are separated into 3 categories called scopes. See Scope 1, 2, and 3 Emissions Explained for a full description, but broadly speaking scope 1 emissions are those directly under an organisations control, such as from fuel that they burn. Scope 2 emissions are those associated with energy consumed by an organisation, e.g. from the grid. Scope 3 emissions are where things get more complicated, as these are emissions associated with goods or services purchased. Pretty much all of the emissions associated with our online teaching platforms fall into scope 3, as they are mostly hosted in datacenters that we have no direct control over.
Scope 3 emissions can be split up into upstream and downstream. The upstream emissions are those associated with the datacenters, such as energy required to store and process the data. The downstream emissions are those that come from users’ devices and the network infrastructure that transfers data from the cloud to the end user devices.
It is an unfortunate reality that I cannot possibly account for the emissions from every process involved with this technology. So assumptions must be made. For example, I don’t think there is a way for me to know what hardware was involved in every data transfer, and so any estimates of emissions associated with it will have to be based on averages for carbon intensity of data transfer. (carbon intensity is the amount of CO2e emissions associated with an activity).
I am hoping that by the end of my internship we will have a better understanding of what the impact of our web services are, and how we can use them more efficiently. I’m looking forward to the next 10 weeks delving into this stuff.


N.B. Closing date now extended to 23:59 on Wednesday, 4th of March.
Thanks Stewart for your encouragement!
Thank you Miki. I very much enjoyed reading this with my morning coffee. It was lovely to have such a…
Hi Otis
What an insightful blog post, I've learnt a lot