Back To The Future – Predictive Dashboards
‘Those who cannot remember the past are condemned to repeat it.’
George Santayana
Life of Reason, Reason in Common Sense, Scribner’s, 1905, page 284
People ask for dashboards and reports to show what has happened. Ideally we would see what is probably going to happen. In the September 2020 blog “Do We Know What We Will Do This September?“, I reviewed qualitative predictions made for September 2019 based on September 2018 data. Buoyed by how well those qualitative predictions turned out for this September I upped the game to making quantitative predictions. The algorithm involved a simple regression calculation using August and September 2019 coupled with August 2020. Here are the results.
| Model Prediction of Tickets for September 2020 | Actual Tickets for September 2020 | % Diff | Result? | |
| Information Services | 29,031 | 28,516 | -1.8% | |
| University Secretarys Group | 24,551 | 20,806 | -15.3% | |
| Corporate Services | 13,409 | 18,795 | 40.2% | |
| Total | 66,991 | 68,117 | 1.7% |
At first glance it looks like the predictions are wildly out. The prediction for Information Services was fine but the ones for University Secretary’s Group and Corporate Services are marked adrift. However the overall prediction is within 2%. Moreover the combined University Secretary’s Group and Corporate Services difference was 4.3% (not shown in table) indicating that perhaps where the tickets are resolved has shifted but the overall demand is highly predictable.
Patterns of Business
The term to describe predictable demand is “Patterns of Business”. The prediction was accurate for overall demand when adjusted for season but differences were evident in support provision. Information Services demand remained predictable. The biggest subcategory for tickets in September 2020 was Payments and Receipts which include Fees. Students with questions about fees are routed to two different areas depending on the nature – querying the invoice or paying the invoice. Perhaps the discrepancies in the predictions are down to organisational changes on how such service requests are fulfilled?
That the demand is very predictable is evidenced by the following graph showing tickets by day, where day 0 represents Arrivals Weekend Saturday for the respective years.
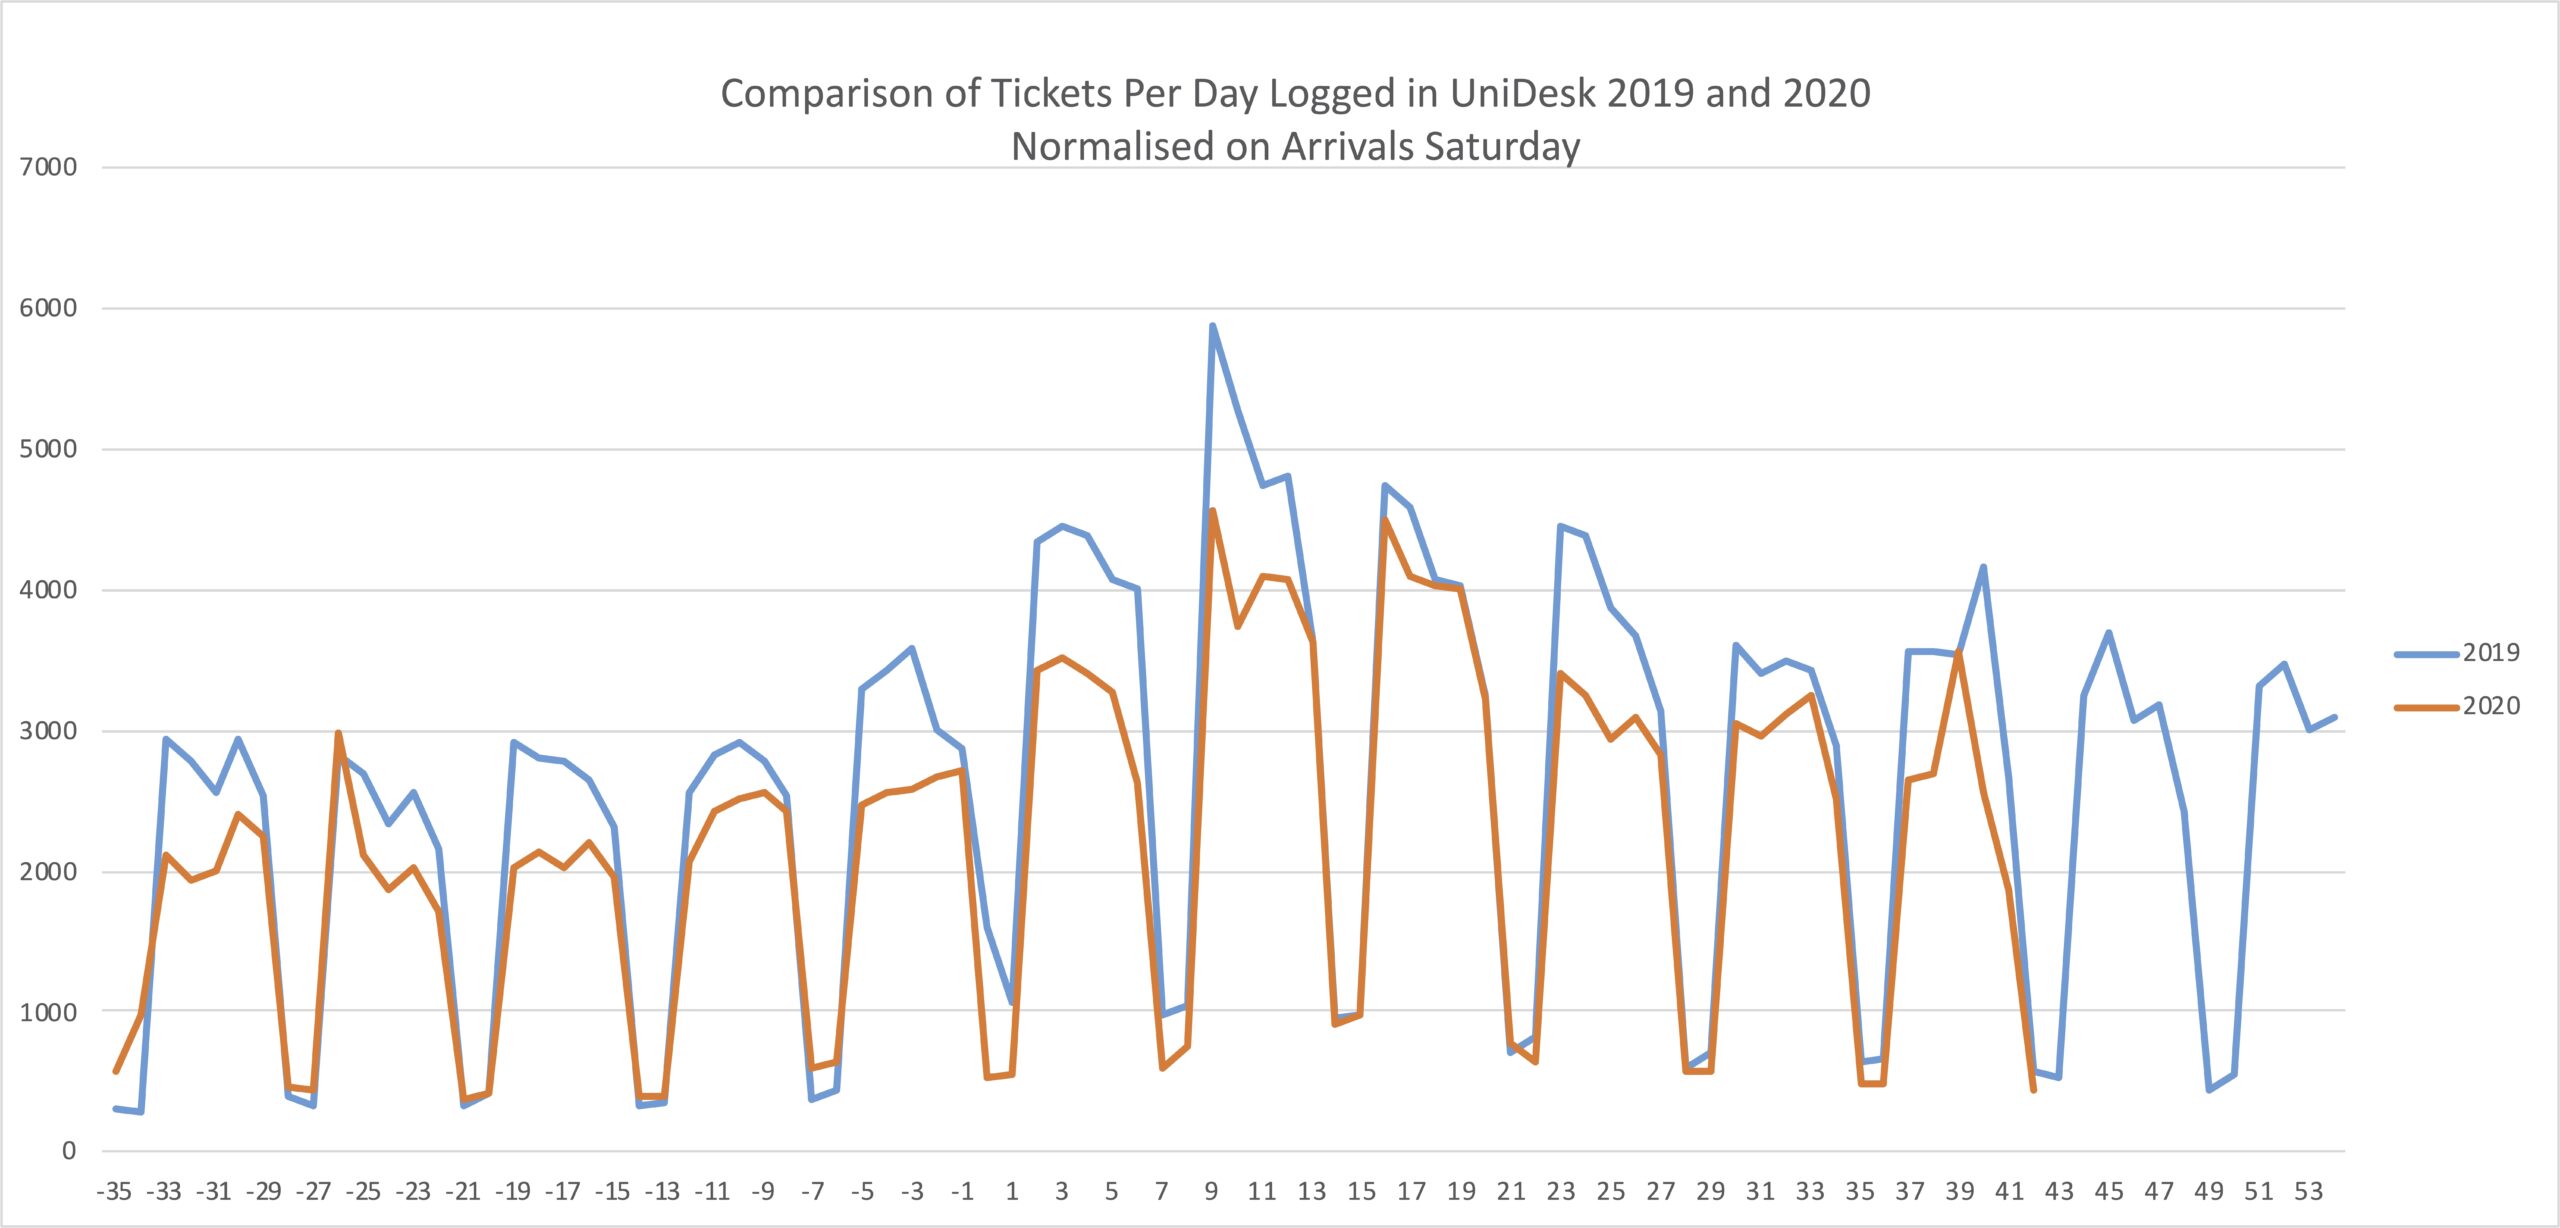
Figure 1 The demand pattern is very similar year on year
The EdHelp Effect
In August 2020 the EdHelp service desk was introduced for students. A key design feature was to have students raise tickets via the Self Service Portal rather than by email. This allowed the students to be prompted in the Self Service Portal with self-help which may preclude the student needing to raise a ticket. So although the overall demand has remained predictable, there are significant changes occurring in the way users and operators raise and handle tickets respectively.
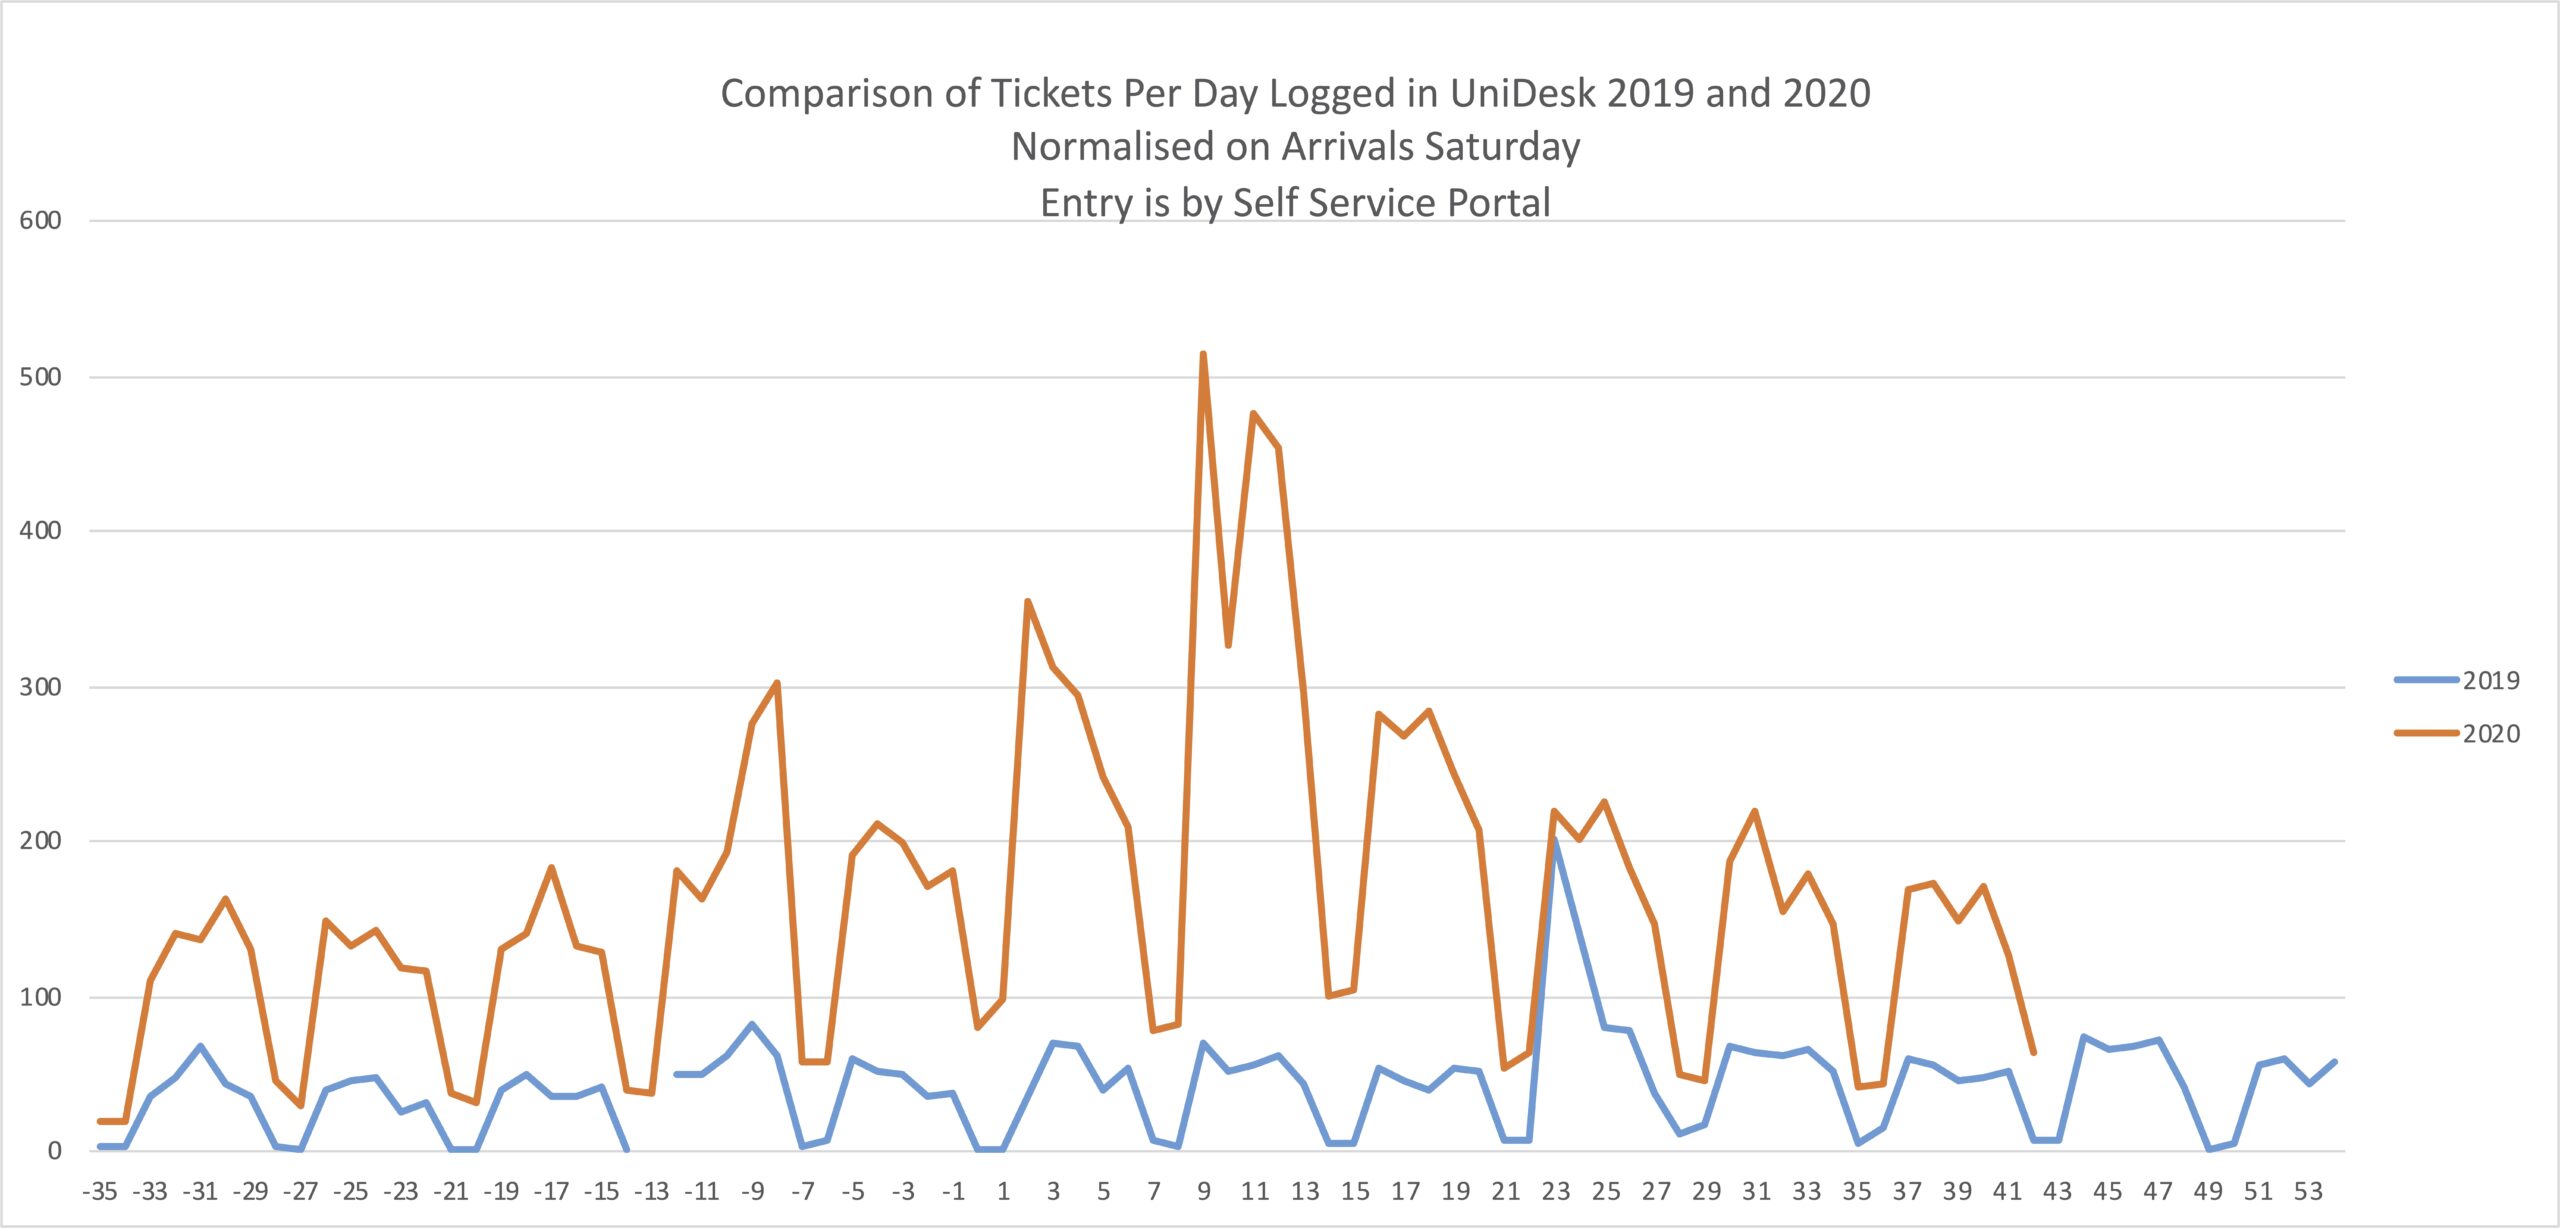
Figure 2: Tickets via Self Service increased in 2020
Pandemic Effect?
With the move to online learning, footfall in University buildings has greatly reduced. This is particularly so in Libraries where service desks are located. Whilst the overall demand showed a similar pattern of business, the way that our users are interacting with our service desks is affected by the pandemic.
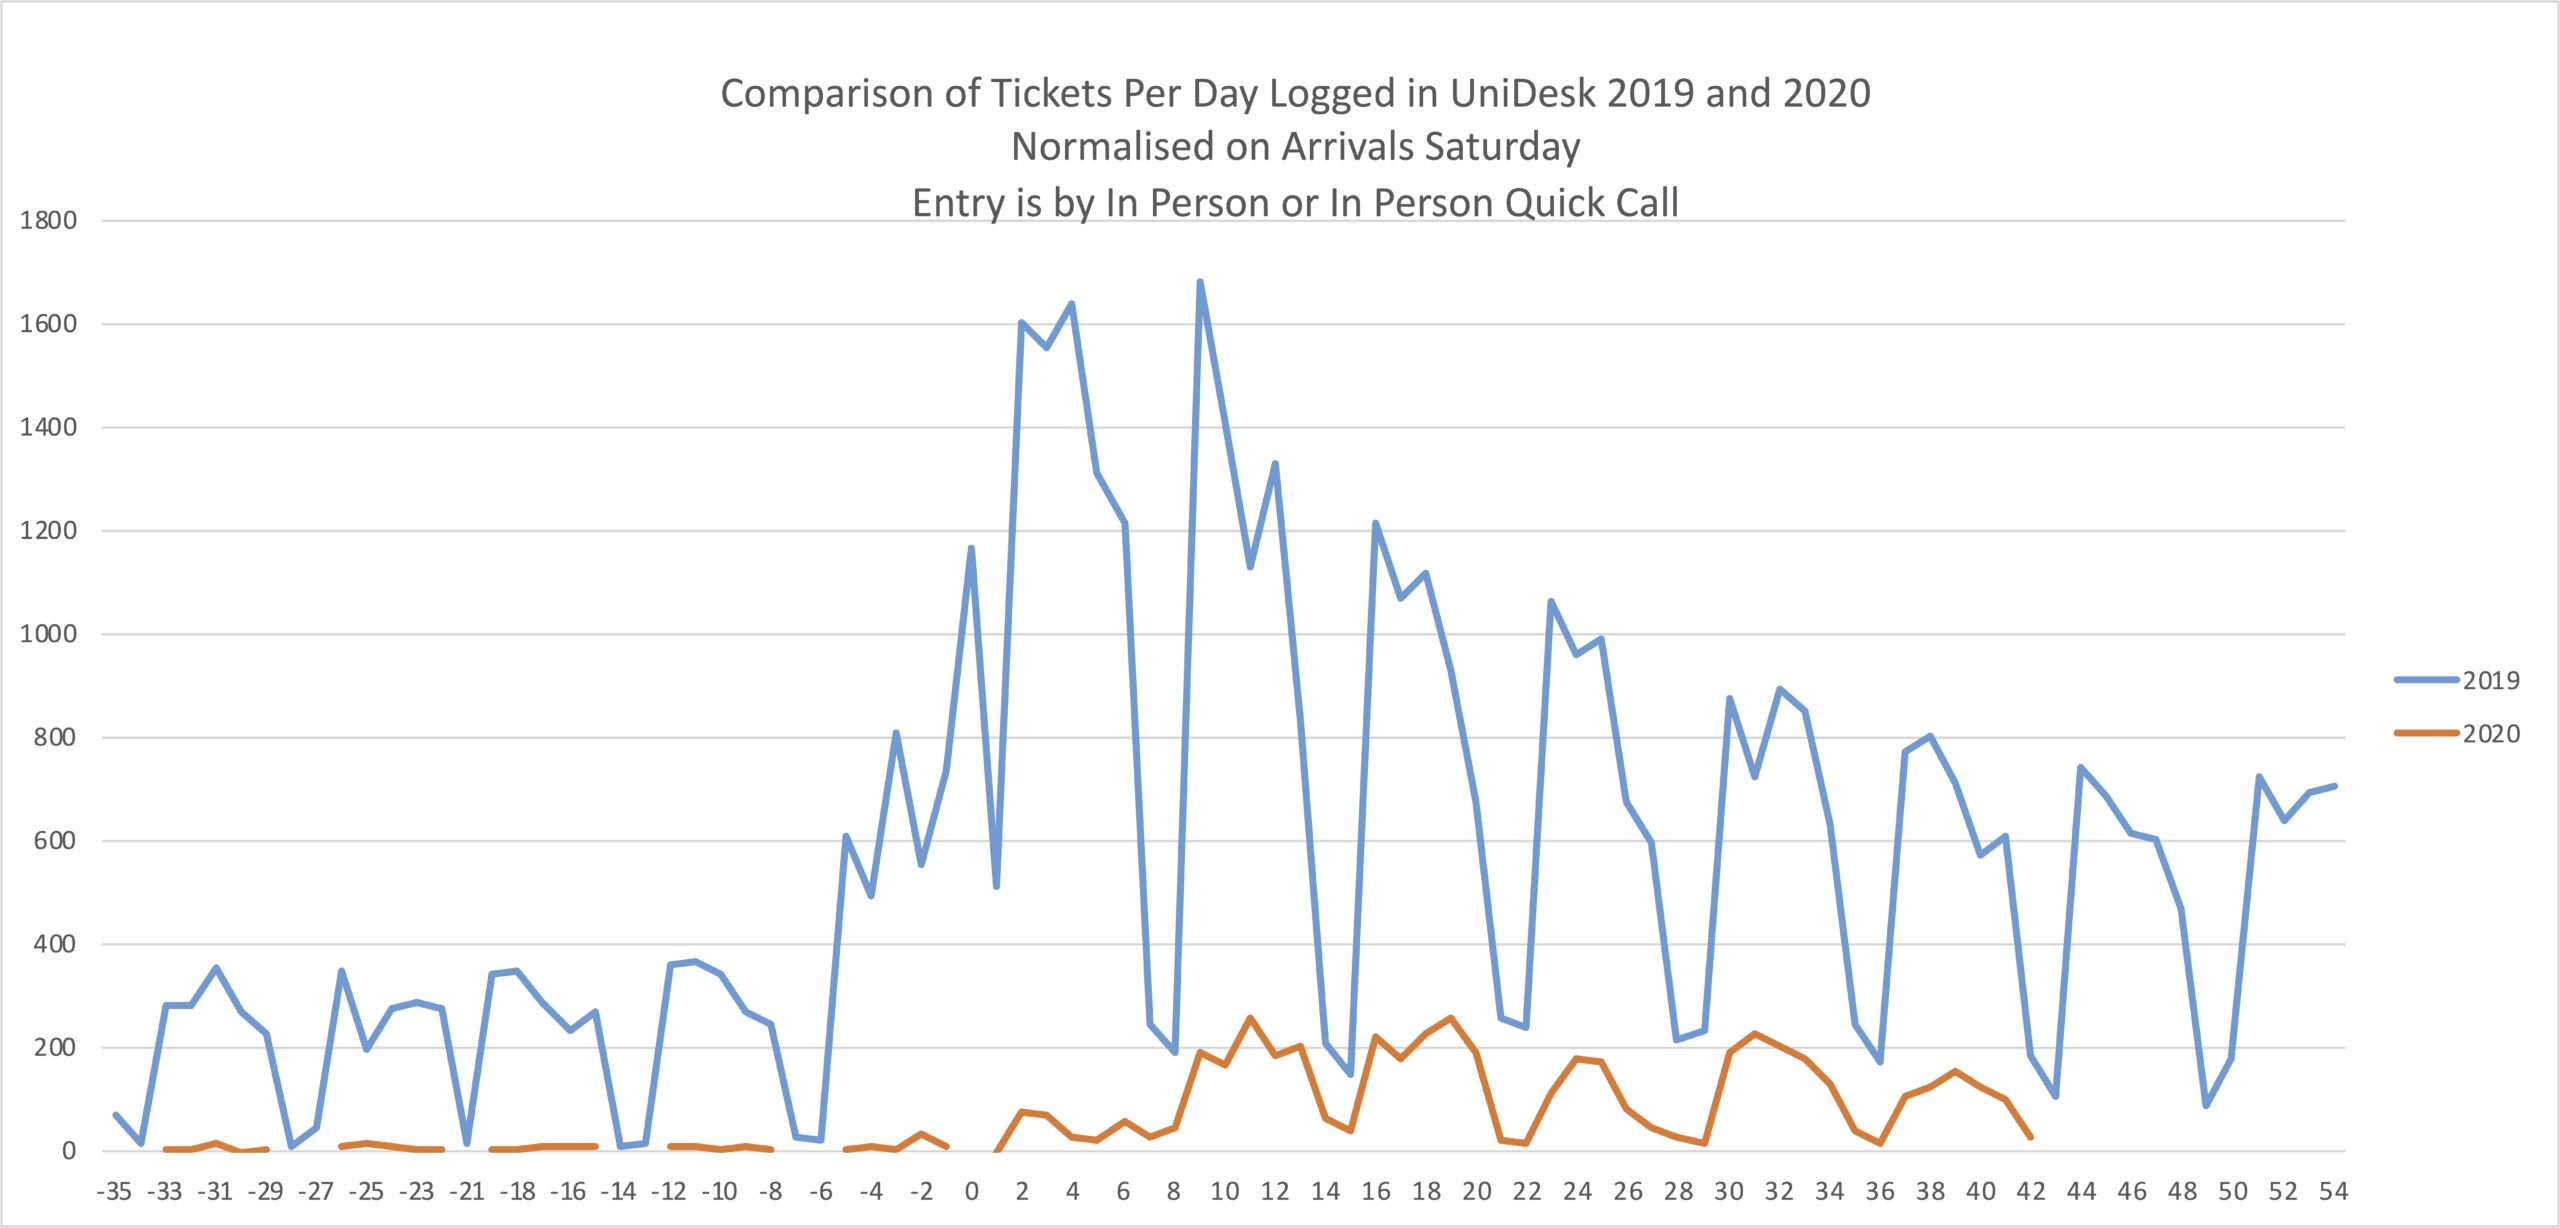
Figure 3: Tickets raised “In Person” in 2019 and 2020
Conclusion
Seeing these patterns aids future predictions. To make predictions one forms a model based on what has gone before. The predictions do not need to be absolutely correct. A wrong prediction prompts investigation that leads to an instructive narrative.
Henry Ford said “history is …(more or less)… bunk”. He did not mean that we should not be informed from history but rather we should be looking to the future. Instead he was expounding what would later be championed by W Edwards Deming – Plan, Do, Check, Act.
Using data and modelling it is possible to extrapolate from those backward looking dashboards and include some insight into what is coming.


Recent comments