As part of our work to demonstrate the impact of Digimap, EDINA has calculated the commercial value of all the data downloaded and maps created for printing. We calculated the values per institution for the period August 2012 to May 2013 then totalled them; this came to approximately £39 .5 million. This estimate is a conservative one as we reduce the quantity of data downloaded by 60% to account for duplication. When all the maps printed and data downloaded were included in the calculation (i.e assuming users would continue to take their own data and maps, and not share them) the value rises to nearly £71 million.

We know that some data is downloaded multiple times within an institution, for example by the students in a class exercise or for specific study sites. We found that only 40% of the data taken from Digimap over a period of time was unique to an average institution. We believe that if institutions were paying commercial rates for their data it would be more likely that they would try to download it once and then circulate it to those who need it; for this reason the value calculations only include 40% of the total. However, there is considerable variation between institutions as to how much is unique; those that do more research or are smaller in size tend to have a greater proportion of unique downloads, so we have included the 100% figure as a ceiling value.
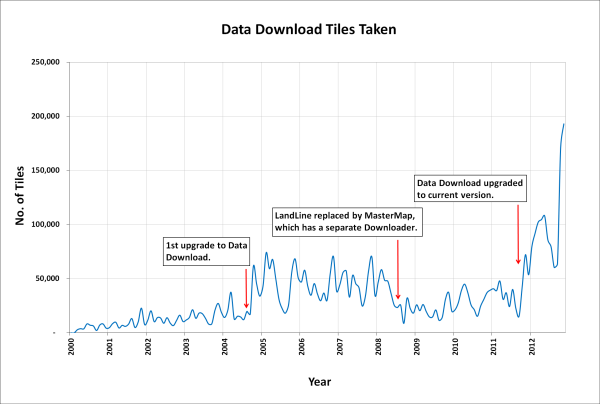
In total, over the past three academic years over £190 million (£100 million at 40%) worth of print maps and data has been served up from Digimap to subscribing institutions.
How the Costs are Calculated

The costs used in our calculations for the data downloaded come from the data suppliers, and include any relevant multipliers or discounts made publicly available on their websites.
The data values are calculated on a per product / per institution basis, with the data preparation and licensing charges assigned only once per product, per institution. Many of the data collections are licensed based on the number of users who have access to the data; with increasing numbers of users a multiplier is applied to a base cost. We applied the relevant multipliers based on the number of active registered users for each collection at an institution. SeaZone data is provided commercially through a third party website; we picked the closest match possible to the data we provide though this does have a lower cost, again making the estimates conservative.
We capped data values at the price it would cost to take national coverage of each product, making it impossible to charge more for any one product than it would to supply the entire dataset for use by the whole institution.
The values for the print maps (including saved images in Carto and Ancient Roam) are calculated by finding the cheapest available commercial map prints from websites such as eMapsite, NLS and FiND. These values are updated every time we calculate the values.
What We Didn’t Include
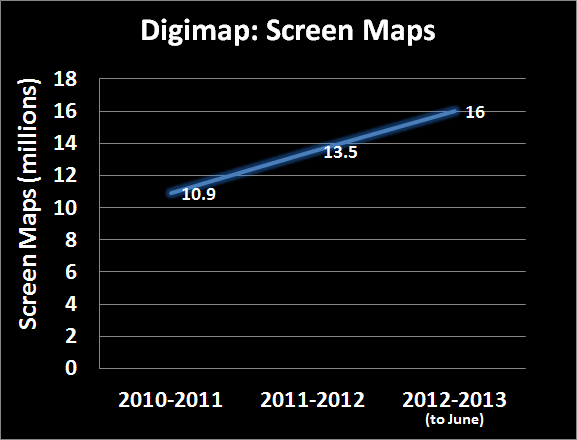
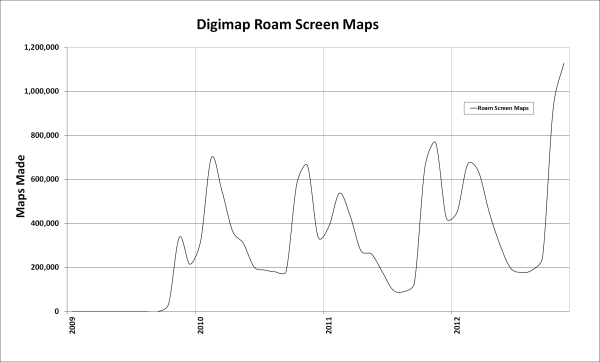
No monetary values were assigned to the millions of screen maps that are produced from Digimap; we couldn’t find a comparable site! Also, the value calculated doesn’t take into account any of the support materials, training courses and help desk facilities that are all part of the Digimap service.
No OpenData downloads or maps created from OpenData are included in the calculation, despite the advantages of producing them from Digimap over other websites.
However the biggest saving that isn’t included in these value calculations is your time. We only charged the data supplier’s preparation and licensing costs once per product or order, in line with each companies policy. In reality there would be many orders occurring throughout an academic year as new research questions are raised. This all costs time, time which the data suppliers will charge for or that institutional staff would have to take to put in requests for data or to create and manage a repository for spatial data.
Digimap does all this work for its subscribers along with providing a high quality mapping interface, 24 hour access to expensive high quality data and maps.
Over the coming weeks we will be sending out each institution’s values to Digimap site representatives. If you are interested in the value of the maps and data your institution has been using then get in touch with them. If you are unsure who your site representative is then please contact us:
- email: edina@ed.ac.uk
- phone: 0131 650 3302