Any views expressed within media held on this service are those of the contributors, should not be taken as approved or endorsed by the University, and do not necessarily reflect the views of the University in respect of any particular issue.
Digimap is an online map and data delivery service, available by subscription to UK Higher and Further Education establishments. Operated by EDINA at the University of Edinburgh, Digimap offers a number of data collections, including Ordnance Survey, historical, geological, aerial photography, LiDAR, marine maps, land cover mapping, global mapping and census data. For more information about Digimap go to our website: https://digimap.edina.ac.uk Background image Contains OS data (c) Crown Copyright and database right 2022
Environment Digimap has been in service for around 4 months now and already has 63 subscribing institutions, over 6000 active users and has made over 35,000 screen maps.
We’d really like to know what you think of the newest Digimap Collection and what you want to see added or improved. Once you have used the service then please go to the following web page and fill in the short survey, it will take less than 10 minutes and will help the future development of Environment Digimap:
If your institution doesn’t subscribe to Environment Digimap yet you still have 4 months where the service is completely free. The following blog post has information on how to subscribe:
For information on how previous Digimap surveys have affected the survey please have a look at the Quality Improvement reports on EDINA’s Benefits of Services page:
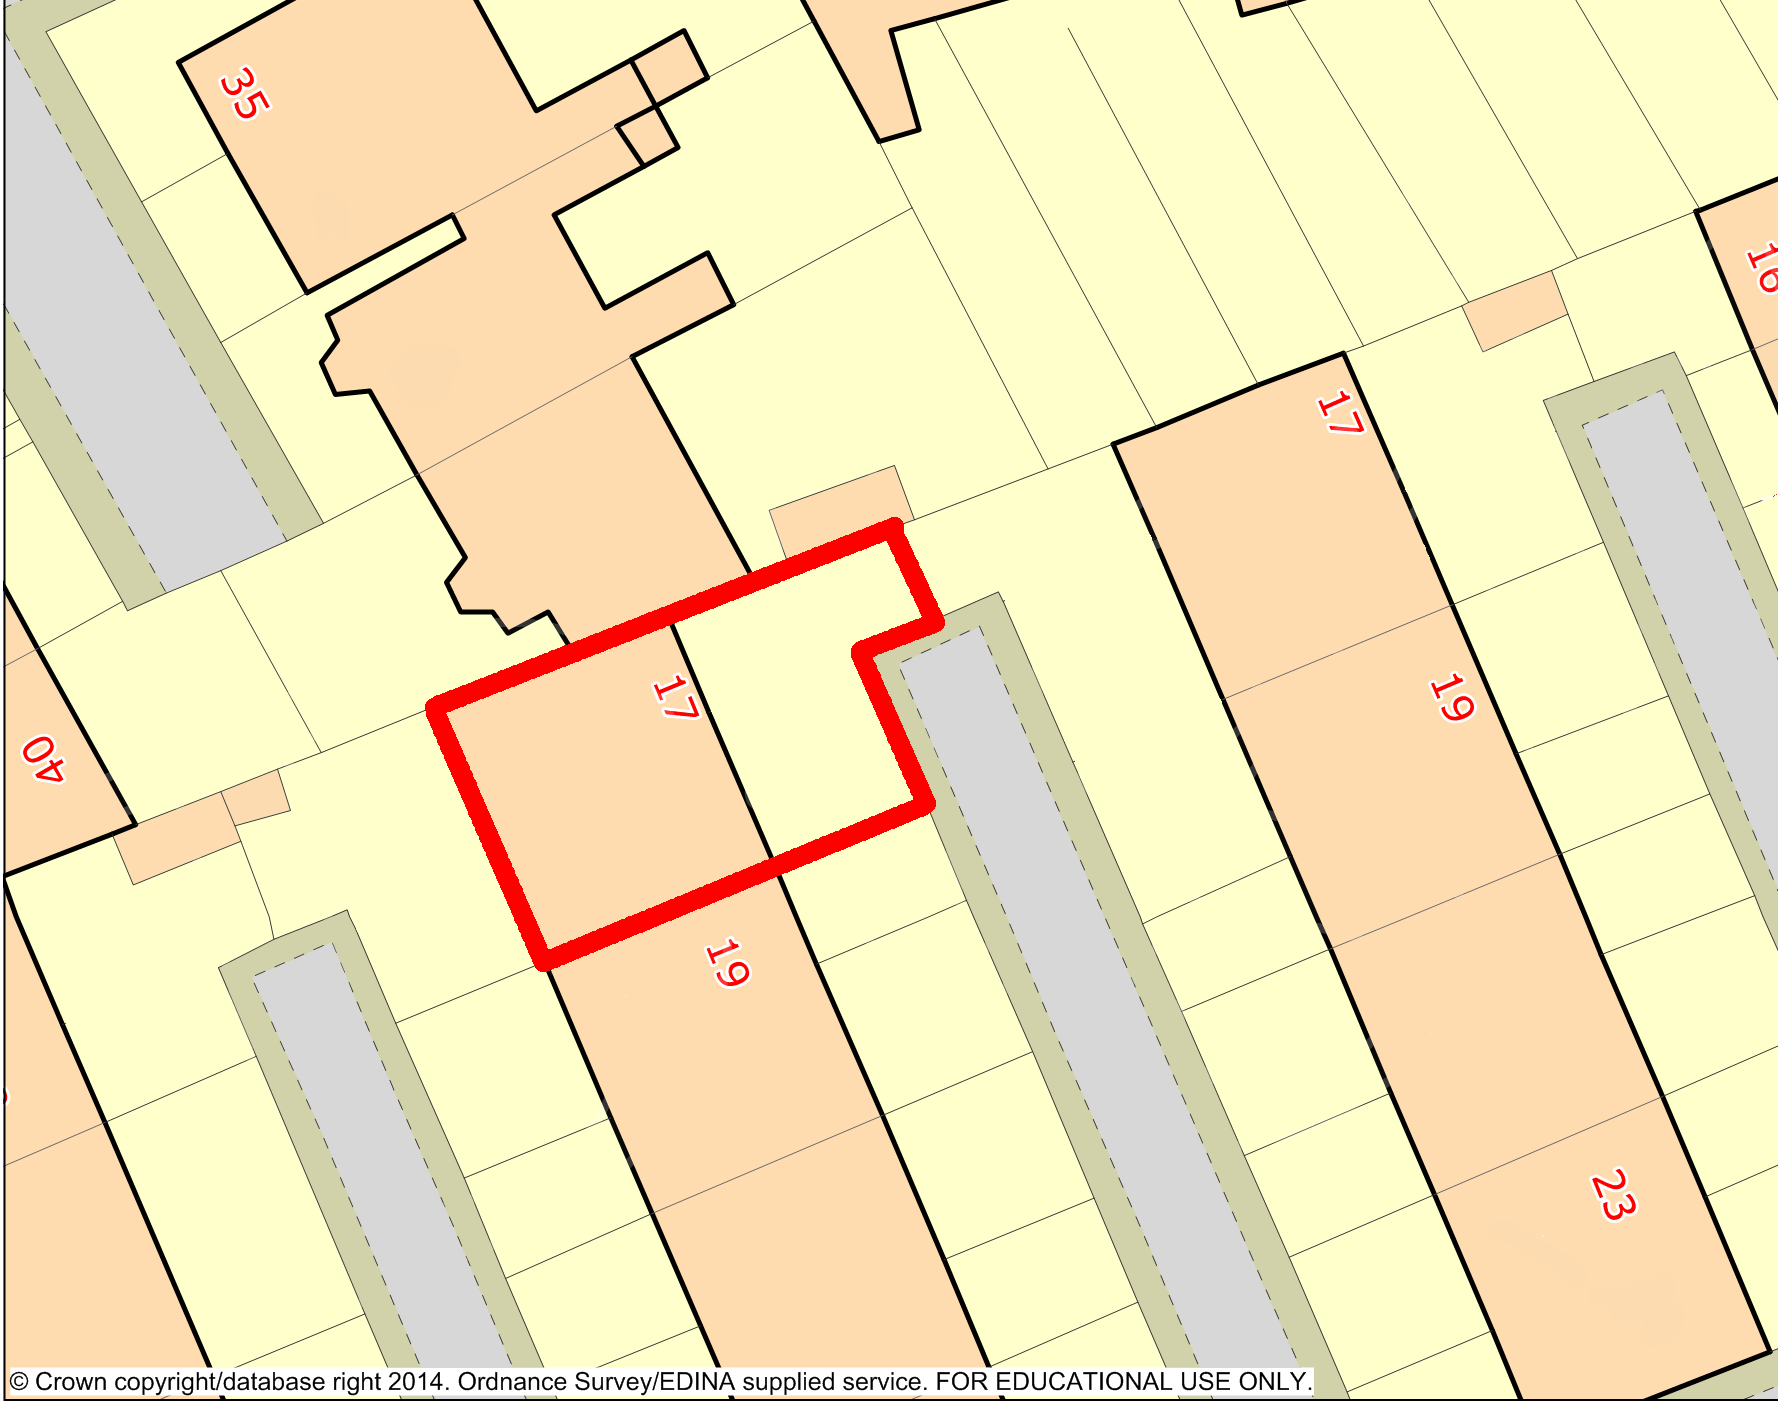
We are often asked whether maps from Digimap may be used in submissions for planning applications. The answer is no. This applies to ALL planning applications, regardless of who submits them, to which authority and under what guise. This includes:
students submitting planning applications to a planning authority as part of coursework or work placement schemes
all private planning applications (commercial or residential)
institutions submitting planning applications for their own premises
members of staff who take on consultancy work involving the submission of planning applications
Maps and plans for planning applications can be purchased from many different suppliers. Promap is one such example. There is also a UK government website called the Planning Portal which can assist with plans and maps.
Ordnance Survey are running a one day event for people to show off their cartography skills; anyone who is able to take up a summer internship can apply.
Jenny Brooker, Prototyping Manager at Ordnance Survey writes:
We’ve come a long way since the days of drawing maps by hand but Cartography is still an integral part of our business, and is so much more than just making pretty maps.
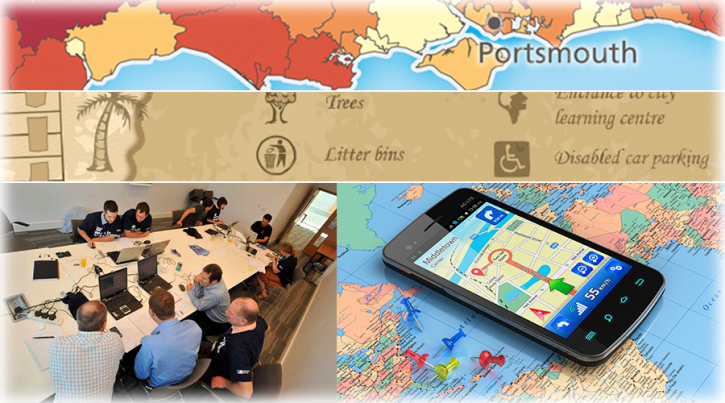
We are inviting anyone with an interest in cartographic design or data visualisation to come to Carto Hack Camp and showcase their skills by spending the day with us visualising geographic data. The winner will be offered a paid summer internship in our cartographic design team.
What Will Happen at Carto Hack Camp?
Our camp will be a day-long opportunity for anyone to visit our headquarters in Southampton, meet our Product Development team and spend the day working with them to come up with an exciting new solution for one of our customer scenarios.
There will be a choice of three different customer scenarios, designed to suit a wide range of backgrounds and abilities. The work will be similar in nature to that carried out by our cartographic design consultants. Find out more about what they do here.
You will then demo your ‘map’ to our panel of Ordnance Survey judges who will rate them and decide on the day’s winner.
Why Should I Get Involved?
It’s an opportunity for anyone with skills and an interest in cartographic design to innovate, create and collaborate with other like-minded people.
Our aim is for an enjoyable, relaxed and pressure-free day. Such an atmosphere will hopefully promote good design and if you want to take it a step further, we will be offering the hack day winner a paid summer internship in the Ordnance Survey Cartographic Design team.
Internship
As a part of the British Cartographic Society’s 50th anniversary celebrations last summer, Ordnance Survey announced that we would offer a paid summer internship for a six to nine week period during 2014 in our cartographic design team. The winner of the hack camp will be offered the opportunity to take up this internship.
Where is it?
We will be setting up camp in the business centre at our own headquarters, Explorer House on the edge of Southampton.
When is it?
Thursday 20th February 2014.
9:30 am – Breakfast
10 am – Introduction
1pm – Lunch.
5pm – Round up of the day and judging.
6pm – Finish
What do I Need?
You need a keen interest in cartographic design or data visualisation and preferably some relevant skills but we welcome applicants from any background. You can bring along your own equipment and software, internet access will be provided. If you don’t have your own equipment laptops can be provided on request (please email cartodesign@ordnancesurvey.co.uk with your requirements prior to the event).
How Much Does it Cost?
The event is free and we will provide complimentary food and drink. All we ask is for your time and for you to arrange your own way of getting here.
EDINA has updated the most detailed maps in Geology Digimap to the latest version from the British Geological Survey (BGS). The 1:50,000 scale maps and data in Geology Roam and Geology Download are now the DiGMapGB-50 Version 7 data from the BGS.
The main differences between this data and the previous versions is that there is an extra tile of data in Wales, EW150 Dinas Mawddwy, and that the linear features are now contained in a single shapefile rather than being in several separate layers. The 7 different linear feature layers; Alteration, Fault, Fold Axis, Fossil Horizon, Landform, Mineral Vein, and Rock are now all combined in a single Linear layer.
The following tiles have all undergone major changes:
Scotland
SC008E_Loch Doon (Superficial)
SC016E_Ettrick (Bedrock)
SC073W_Invermoriston (Superficial)
SC084E_Nairn (Bedrock)
SC092E_Loch Fannich (Bedrock)
SC101E_Ullapool (Superficial)
SC102W_Oykel Bridge (Bedrock)
SC108W_Ben Hee (Bedrock)
England & Wales
EW039 Kendal (Superficial)
EW075 Preston
EW085 Manchester
EW086 Glossop
EW100 Sheffield
EW112 Chesterfield
EW150 Dinas Mawddwy
EW167 Dudley
EW174 Thetford
EW203 Bedford
EW224 242 Colchester Brightlingsea
EW247 Swansea
EW265 Bath
EW283 Andover
EW310 Tiverton
EW346 Newquay
For more details about the 1:50,000 and other DiGMapGB datasets you can download the Information Notes directly from the BGS: DiGMapGB Information Notes
We are often asked whether Ordnance Survey maps from Digimap can be published on the web and whether the Digimap licence allows this. The simple answer is yes, but there are (as always) caveats. The most obvious one is that any maps from Digimap that you publish on a website must relate to your academic work. That applies to the use of Digimap, regardless of what you do with the maps or the service.
The section of the Ordnance Survey Licence you need to look at is Schedule 2 of the Second Variation Agreement. This was originally called Appendix 4 under the original 2007 – 2009 licence, but has since been superseded by the first and second variations. You can find all the licence documents online here:
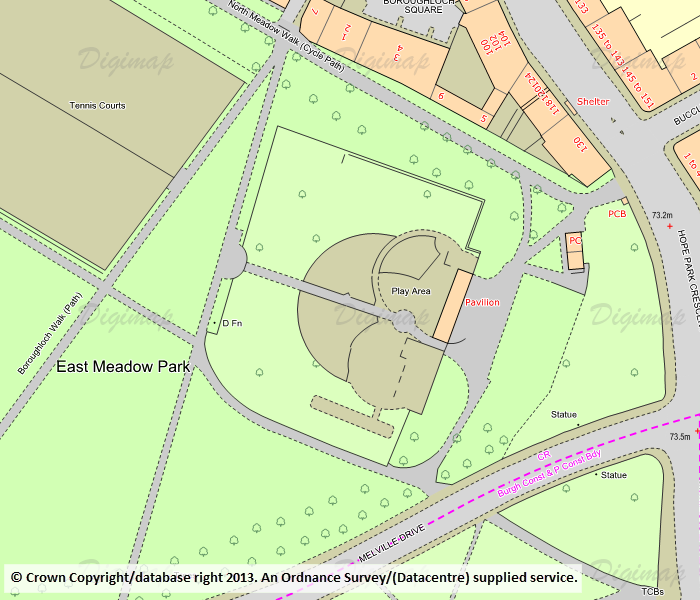
If you wish to publish a static image on your public-facing, “open to the world” website, you may do so on condition that the image is no bigger than 1 048 576 pixels. This is the equivalent of a square 1024 x 1024 pixels.
If you wish to publish a static image on an intranet page, that is, a website with access restricted to members of your institution, there are no restrictions on the size of the image you can use.
You can publish as many images as you wish, as long as each one is less than 1 048 657 pixels (1024 x 1024 or equivalent).
Interactive Mapping
A more common and complex question is whether you can put up a “zoomable” map with your own data overlaid on it. If this is what you wish to do, you need to consider the following stipulations in the licence:
When rendering mapping on a website:
Only Digital Maps may be published. Digital Data and mapping in GeoPDF format may not be published at any time.
It must only be available as an image and not be accompanied by drawing or measuring tools.
It is permissible to zoom in and out to enlarge or reduce the viewing scale of a discrete map image but not to change from one dataset to another of higher/lower resolution.
It is permissible to pan to the edge of a discrete map image (where the ‘viewing frame’ is smaller than the overall image).
Digital Maps may be displayed at any size on screen.
More than one Digital Map may be included but no single Digital Map may be of a size greater than specified above.
Note that “Digital Maps” is a capitalised term and is specifically defined in the licence agreement. The definition given is: “any or all of the maps created by a Datacentre from the Licensed Work to be used in a Service provided by a Datacentre.” In essence this means any map created by Digimap which is “non intelligent”. That is, it contains no vector data, cannot be interrogated to extract data of any sort (in the same way as one might interrogate a satellite image to identify the spectral signature of a particular pixel), and is a dumb image.
Given these stipulations, you are not permitted to use the Ordnance Survey licensed data available through Digimap to display a series of maps using different OS data products which the public can zoom in and out of, pan around the whole country and add their own markers to, in a similar way to many other online mapping services (such as Google Maps or Apple Maps or OpenStreetmap). Note that this does not apply if you wish to use the OS OpenData, which is also available through Digimap.
Alternative Sources of Mapping
If you do wish to create an interactive mapping function on your website, you might like to consider the alternatives to using licensed Ordnance Survey data. EDINA operates a free service called OpenStream which provides OS OpenData through an API. You need an academic email address to register for OpenStream (ending .ac.uk) , but it doesn’t cost. The maps area available under the OS OpenData licence and the licensing terms are therefore much more flexible than the data licensed through Digimap.
As ever, if you have any questions about what you can and cannot do under the Digimap licence, please do not hesitate to contact EDINA with details of what you wish to do, what data you wish to use and who you intend should benefit from your work. We are keen to hear of licensing questions you would like to see explained further on this blog.
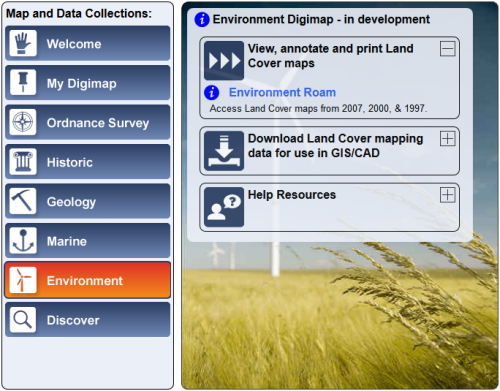
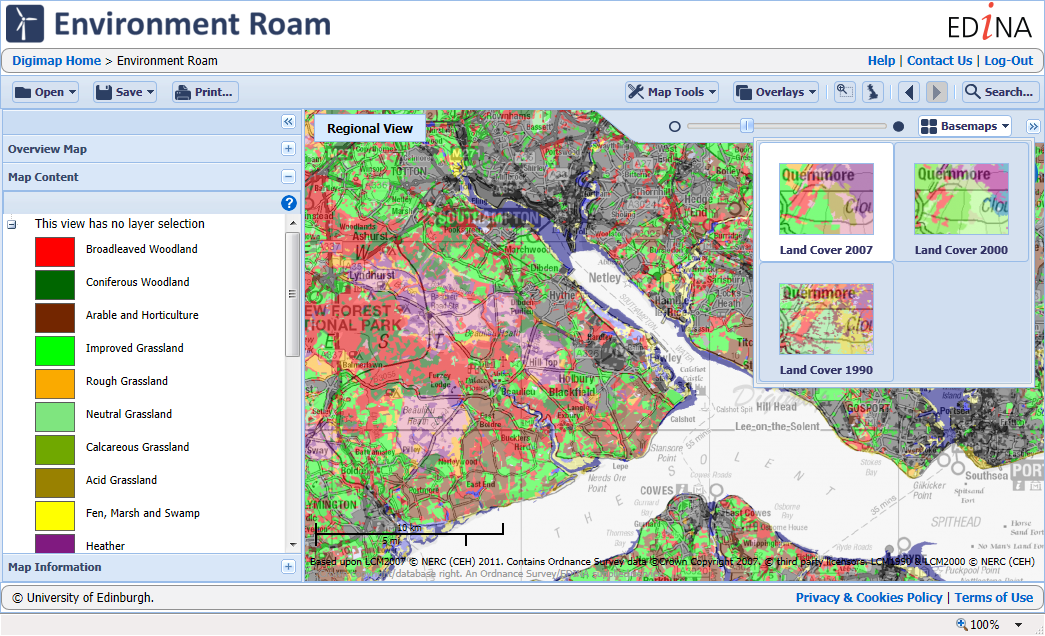
EDINA and Jisc are pleased to announce the launch of a new Digimap Collection, Environment Digimap.
This new collection offers land cover map data from the Centre for Ecology & Hydrology (CEH). Environment Digimap is a subscription service; however, it will be available free of charge until 31 July 2014. After this period a subscription fee will apply per institution.
Environment Digimap offers two facilities: mapping through Environment Roam, and the ability to download data through Environment Download. The data available, CEH’s Land Cover Map products, provide a snapshot of land cover for each of the years 1990, 2000 and 2007. There are raster datasets available at 25m and 1km resolutions for each year and a vector version of the 2000 dataset. The data are in a range of formats depending on the year. More details are available in the Environment Digimap Help Pages: CEH Products Available
How to get access…
To use this service for free your institution needs to subscribe, this is free till the end of the 2013 – 14 academic year and can be arranged via the Jisc Collections website:
If your institution doesn’t subscribe the Environment Digimap button on the home page will be grey. Contact your Digimap site rep and they will be able to help arrange your institutions subscription: List of Digimap Site Reps
If you have any questions about Environment Digimap, please contact us:
We have updated three of the mapping datasets in Digimap Roam, so you can now view mapping published as recently as June 2013.
The products updated are:
OS MasterMap: used in the three most detailed zoom levels in Roam.
OS VectorMap Local (VML): the next most detailed maps in Roam, available as alternate “Basemaps” in the 4th and 5th most detailed zoom levels.
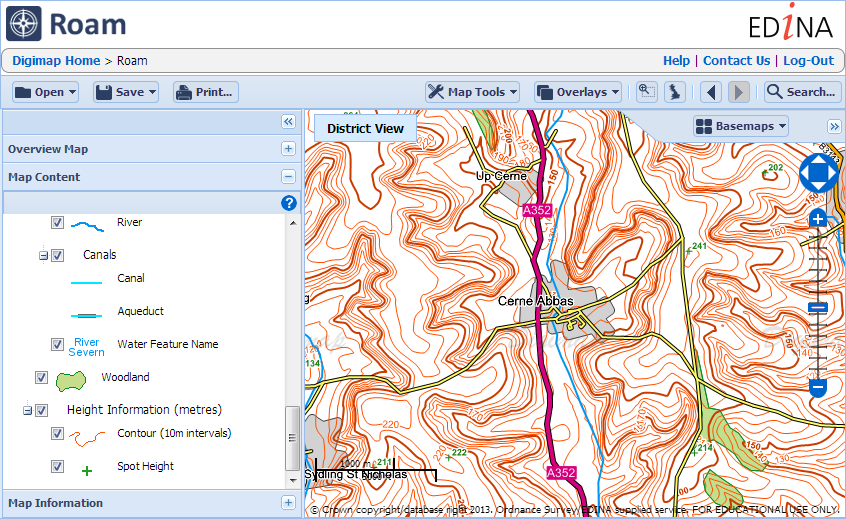
Midscale Maps: These maps are made of the Meridian 2 mapping data along with contours. Until now they had been made with Land-form PANORAMA data, but now they use the new OS Terrain 50 contours:
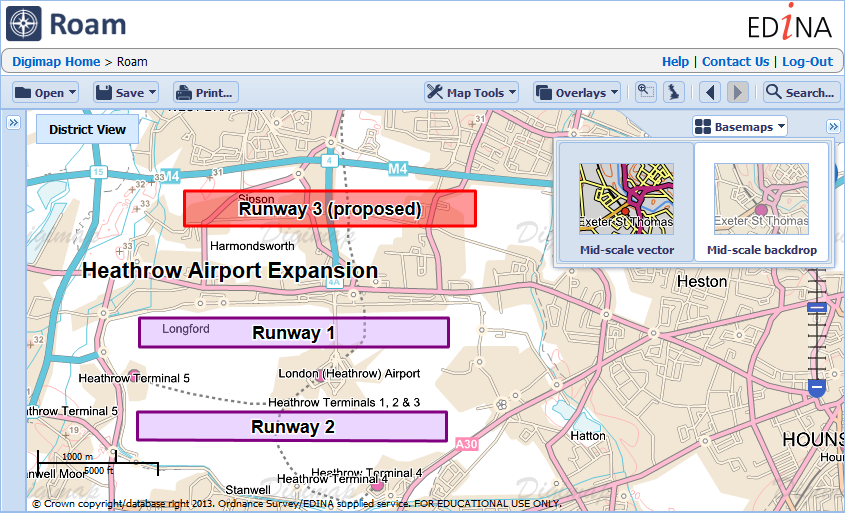
These midscale maps are also available in a backdrop colour scheme which can be accessed by using the Basemaps tab at the top right of the map. The faded colours allow your annotations to show more strongly:
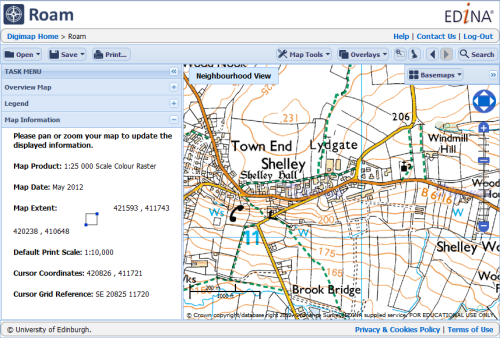
The updated datasets are also available from Digimap’s Data Download service (except MasterMap which will follow in the next few months), a page in Digimap Help details the all the OS products available and their currency in Roam and Data Download:
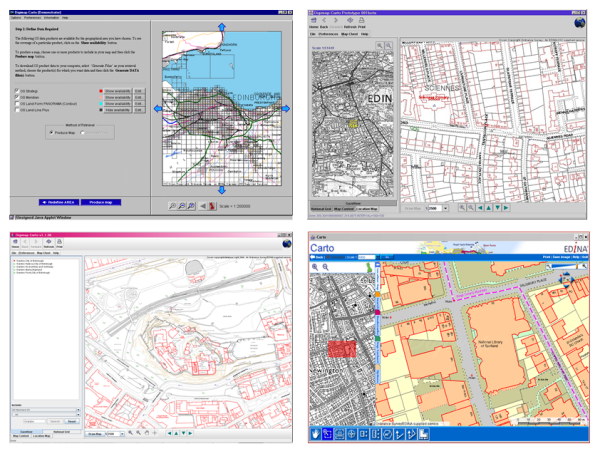
At 11:00 am access to Digimap Carto will be closed and by 12:00 noon it will have made its last map. Carto was at the cutting edge of web mapping technology for several years, delivering Ordnance Survey maps to thousands of users while Google was still just a search engine. The high quality EPS and then PDF print files it produced meant that staff, students and researchers could print out maps of anywhere in Great Britain and were no longer limited to their library’s collection.
Carto over the years 1998 to 2013
As time passed Carto could easily keep up with the latest offerings from MultiMap (later bought by Microsoft and eventually becoming Bing Maps) and Google Maps. It had more advanced tools and much better data in the form of OS MasterMap, so as the Java updates got more frequent we all put up with the software being a bit unreliable for a few days before we could issue a fix. However after 2011 the number of Java updates ramped up significantly and the changes became more difficult to accommodate. Once anti-virus software began seeing Carto as a potential threat and preventing it operating we decided that maintenance was unsustainable.
EDINA realised that continuing to support Carto would be too costly in terms of developer time spent fixing problems rather than improving and enhancing the service. In the meantime the rest of the world had become much more accustomed to viewing maps online in a web browser; EDINA’s other mapping service, Roam was able to take on much of what Carto was offering without confusing or frustrating its users.
Some recent changes to the capabilities of the web mapping platform that Roam uses meant that we could finally offer a Carto replacement without the need for any software to run on the end user’s computer. These changes have allowed us to withdraw Carto and let Roam to take on all the mapping duties for Digimap. We can now get on with the business of all those improvements and enhancements we have been wanting to make. We hope you will like the changes that we are aiming to have in place this August:
As part of ongoing efforts to improve the usability of data delivered by Digimap, we have made some significant enhancements to one of the Ordnance Survey licensed datasets.
OS VectorMap® Local is a relatively new product from Ordnance Survey providing slightly less detail than OS MasterMap but still very useful for detailed backdrop mapping. Individual buildings are shown as well as roads, rivers, landcover and contours. The vector version of the data is provided by Ordnance Survey in GML 2.1.2. This is a standard geospatial data format developed by the Open Geospatial Consortium; however it generally needs to be converted into a proprietary format before being used in GIS and CAD software.
To make using this data easier we are now providing OS VectorMap Local in both Shapefile and DWG formats. Shapefiles can be easily opened in ArcGIS and most other GIS programs including OpenSource GIS software such as QGIS and gvSIG. DWG is the native format for AutoCAD and can be used in many other CAD systems as well.
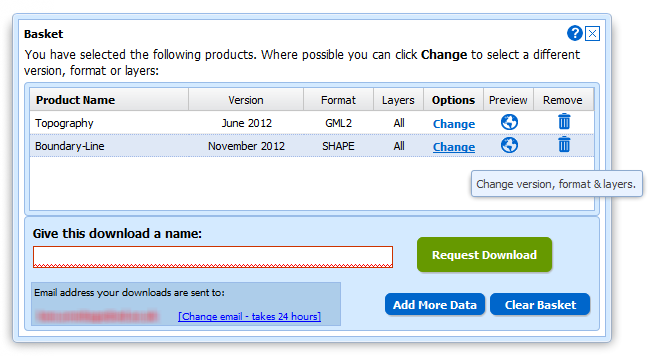
This data is now available for download from the Data Download application in the Digimap Ordnance Survey Collection. VectorMap Local is in the Vector Data section; to change the format of the data you are downloading click on the Change link under Options once you have added it to the basket.
Click image to view full size.
Creating the data:
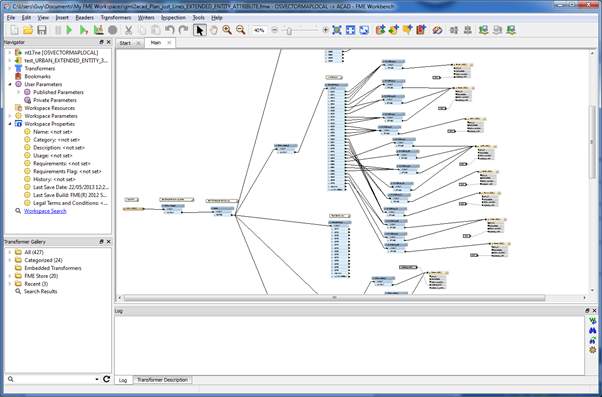
TO achieve the best results when recreating the data in different formats we had to use different software products for different formats. To convert the data to Shapefile we used the OpenSource Software GDAL program called “ogr2ogr” and for the DWG conversion we used FME from Safe Software. The image below shows part of the FME Workbench project used to convert the data to DWG.
Click image to view full size.
1: Shapefiles
To convert the GML to Shapefile we created a lookup table between the Feature Codes in the GML data to Shapefile Layers. As Ordnance Survey do not provide any guidance in their User Guide as to how to group features in VML , we analysed the data and experimented with various groupings, so that in the end we split the data into a possible 22 separate Layers. These layers may contain multiple feature classes but as they all have the original feature codes on them as attributes as well as all the other original attribution, further distinction between features can be achieved for representation and querying.
Example of the Shapefile data in ArcMap:
Click image to view full size.
A simple set of Layer Files has been created for use in ArcMap and can be downloaded from the VML Help page.
2. DWG
To convert the data to DWG we had to go through a similar process (as well as our data team becoming much more familiar with AutoCAD). We originally intended to produce DXF format data but this turned out to be a problem. We had to make some decisions about how to store attribution in the output data and one of the main considerations was the size of the resultant files. To begin with when we converted a tile of VML that was 60Mb of GML, it expanded in size to 240Mb when converted to DXF containing attributes as Inserts. This was unusable in systems we tried so we had to work on ways of making the files smaller. The first thing we did was change the format from DXF to DWG. As both formats are commonly read by various CAD systems this seems a reasonable thing to do although it may make the data slightly less interoperable. This changed the file size to 44Mb for our sample dataset. This was still quite large and some systems were having problems with this, especially when dealing with tiles in dense urban areas. We therefore decided to change the way we were storing attributes in the data. Instead of using Inserts we used Extended Entity Data (or XData) which was one of the options available in FME. This stores a fixed amount of information against an entity in the drawing. We use this to store the attribute information that was in the original GML data, including the original feature code. It’s a bit more difficult to work with this data but it can be viewed in AutoCAD Map 3D by using the Express Tools –> Tools –> List Object Xdata or typing xdlist in the command prompt.
Using XData brought the size of our sample tile down to 10Mb and was usable in all the systems we tested it with. If you need access to the attributes either as Inserts or as Map 3D Object data please let us know.
As part of the conversion process we defined the representation for features in the DWG file, including point symbols and area fills. Features have also been grouped together into separate Layers as we did with the Shapefiles.
Example of the data in AutoCAD:
Click image to view full size.
Finally, after getting the project set up in FME and a thorough testing of the data, we ran the batch process to convert the data. This took nearly 3 days per format to convert the full load of our national coverage of VML data. This data will be updated on the normal update schedule, as we get updated VML from Ordnance Survey as Change Only Updates so future conversions will be much quicker.
Remember,both these datasets are available through Data Download by selecting VectorMap Local and then changing the format after you have added the data to your basket.
We intend to produce alternative formats for other products, including OS MasterMap, so we would very much like to hear your thoughts on the data that we have produced so far and let us know if this meets your needs.

 We’d really like to know what you think of the newest Digimap Collection and what you want to see added or improved. Once you have used the service then please go to the following web page and fill in the short survey, it will take less than 10 minutes and will help the future development of Environment Digimap: