Any views expressed within media held on this service are those of the contributors, should not be taken as approved or endorsed by the University, and do not necessarily reflect the views of the University in respect of any particular issue.
Digimap is an online map and data delivery service, available by subscription to UK Higher and Further Education establishments. Operated by EDINA at the University of Edinburgh, Digimap offers a number of data collections, including Ordnance Survey, historical, geological, aerial photography, LiDAR, marine maps, land cover mapping, global mapping and census data. For more information about Digimap go to our website: https://digimap.edina.ac.uk Background image Contains OS data (c) Crown Copyright and database right 2022
The July 2022 version of the OS MasterMap Water Network has been released for Data Download. It’s available from Digimap as GML3 and you can read more about the data on the Ordnance Survey website here.
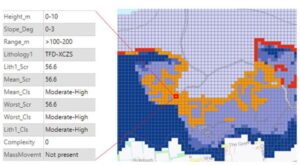
Geology Digimap now offers the new GeoCoast dataset, which replaces the Coastal Vulnerability dataset. GeoCoast is available from Geology Download under the Onshore Geology section. It is available in Shapefile format and only as a national datasets (it’s not possible to select a particular area – the whole dataset will be included in the download).
This Coastal Vulnerability dataset has been withdrawn and is no longer supported by BGS. However, it remains available through Geology Digimap under the Archived Datasets section. It is provided “as is” and used at your own risk.
Example of GeoCoast data courtesy of British Geological Survey.
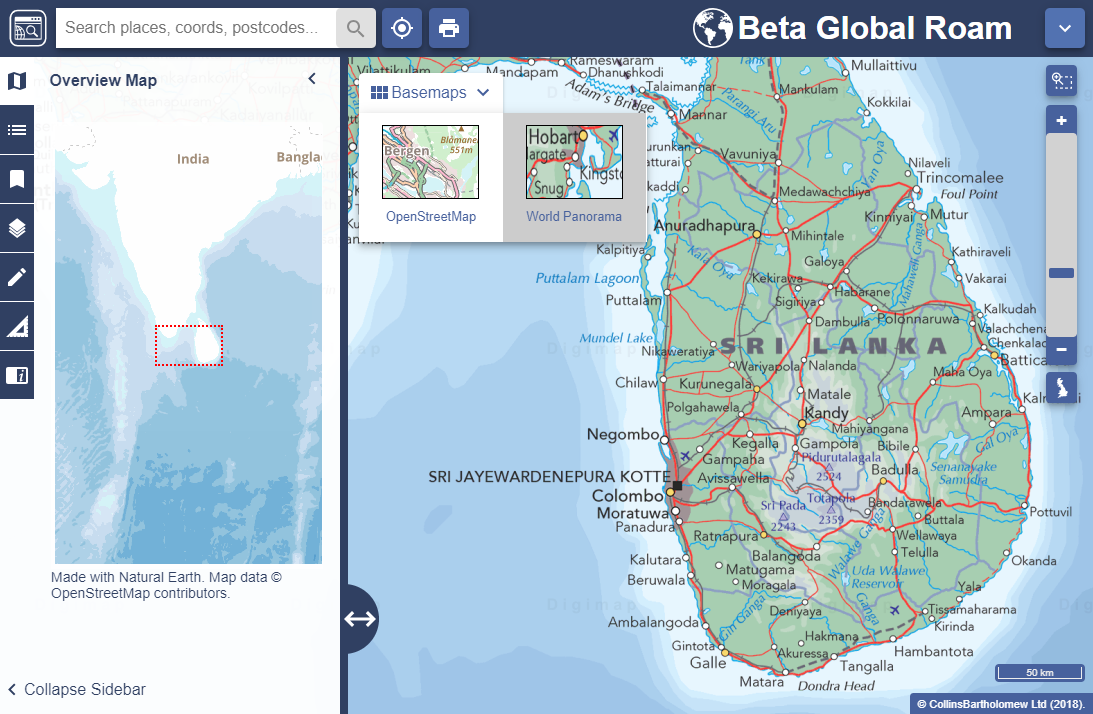
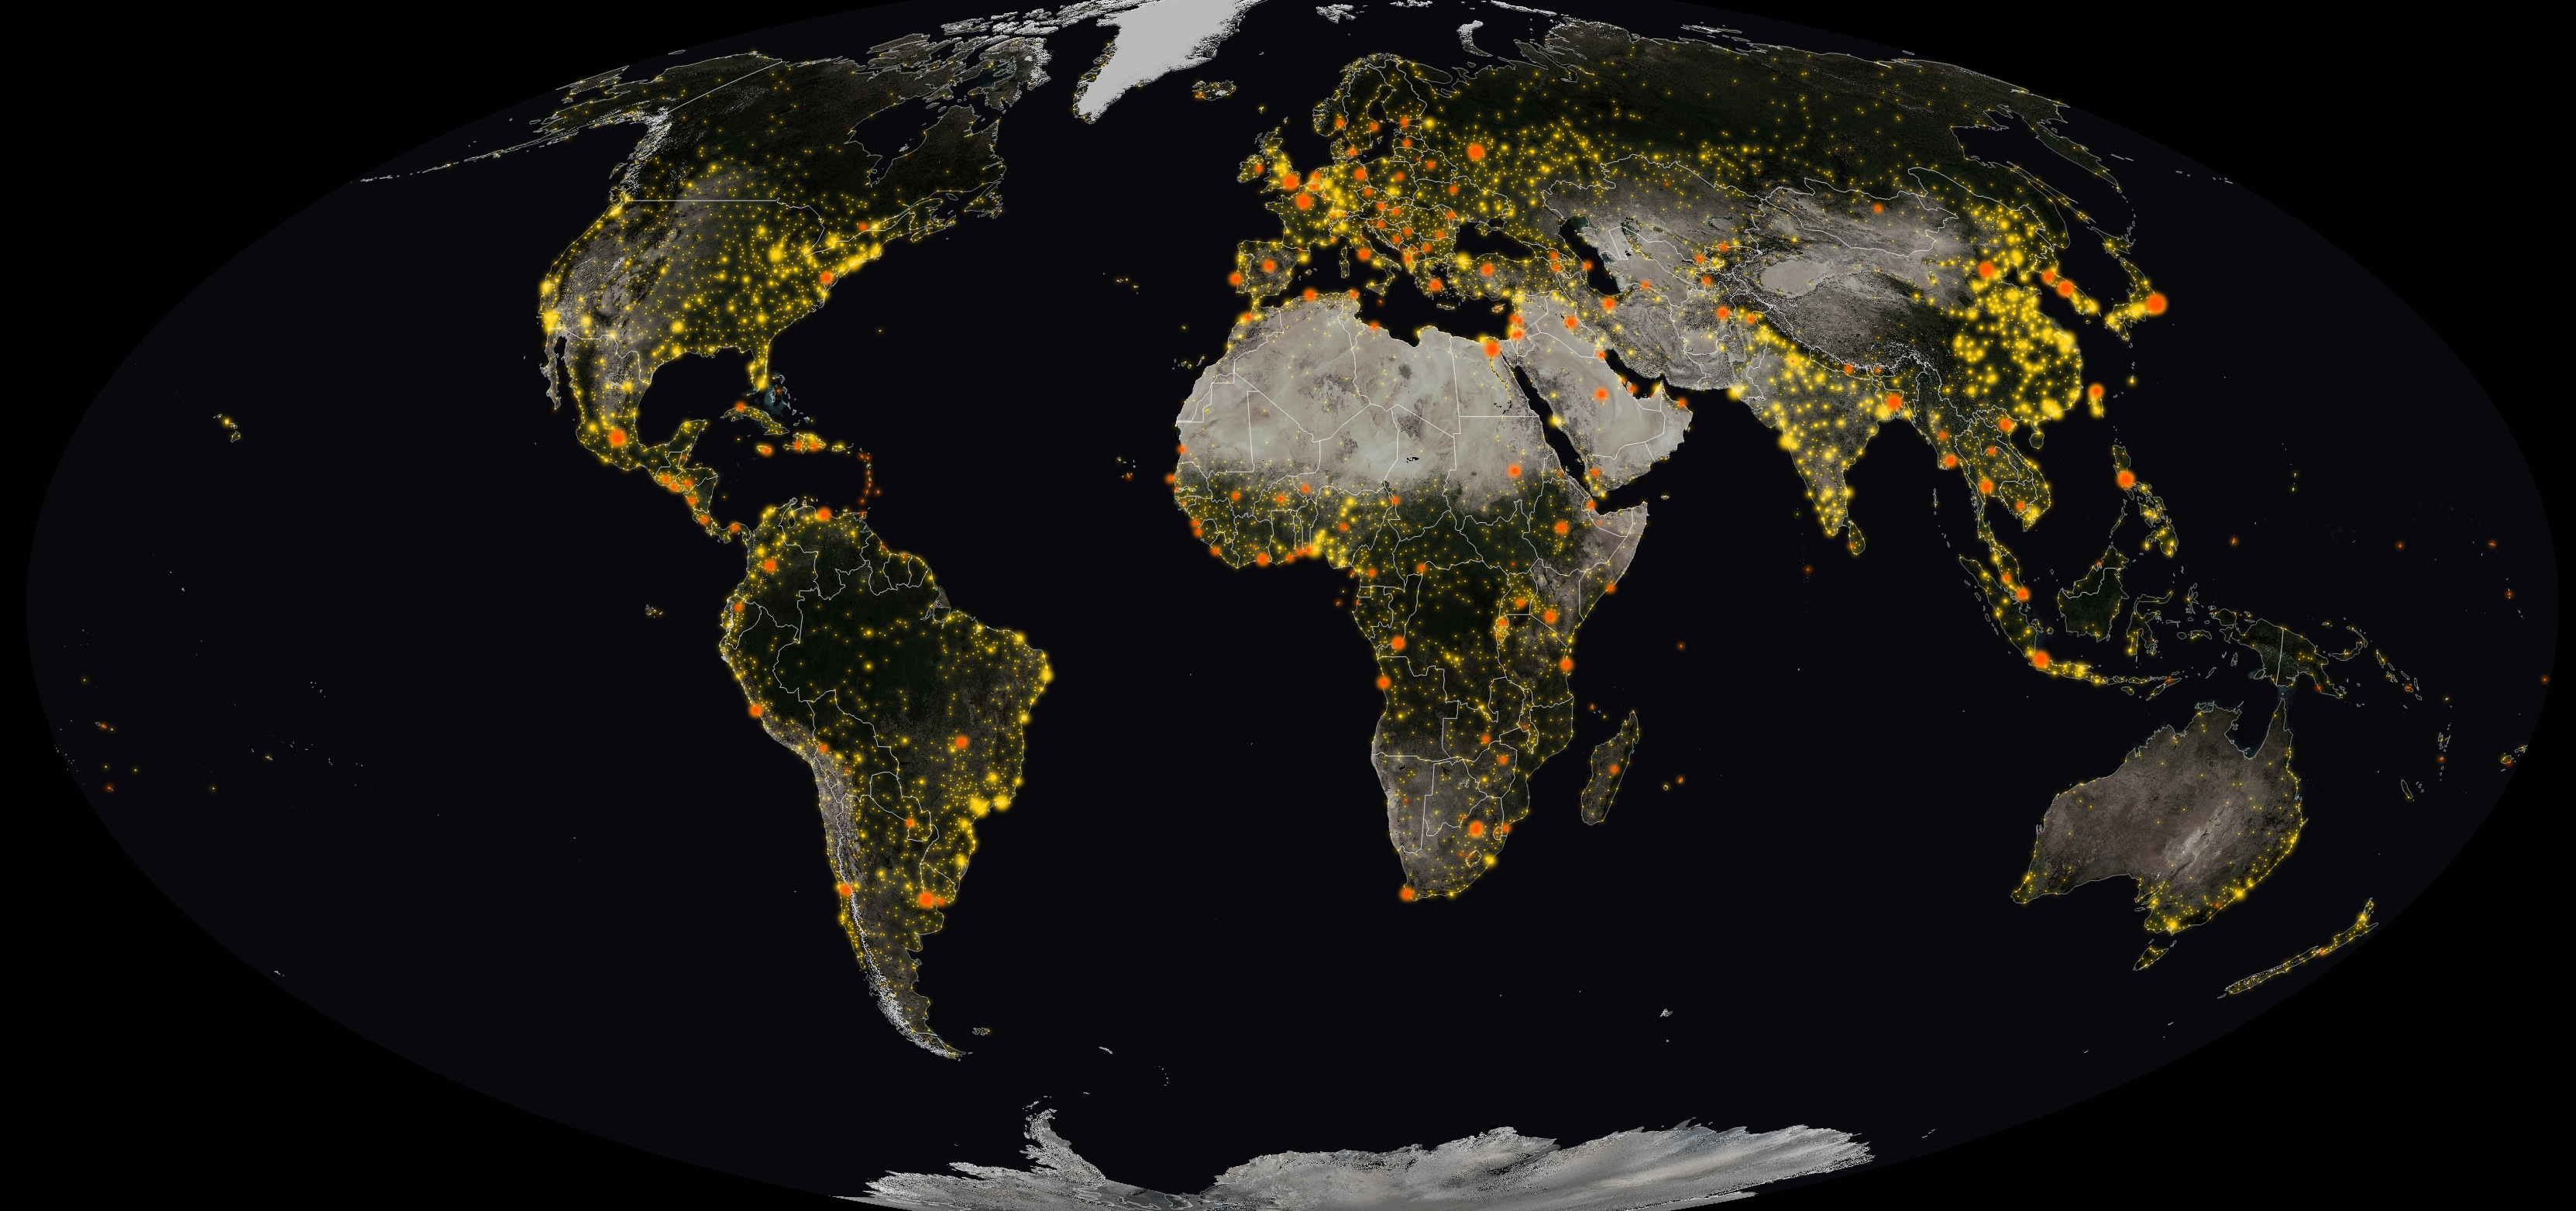
This beautiful new addition to Global Digimap is an excellent addition providing a wonderful cartographic product ideal for small scale extents.
EDINA feel this addition, available via it’s ‘Alternate Base Map’ function is a perfect enhancement to the collection. With it’s origins in The Times Atlas, World Panorama exemplifies what is best about a mapping product where cartographic presentation is at the fore. With a geopolitical committee sitting behind the product, providing input on boundaries and territory disputes it is the epitome of an authoritative dataset. This provides excellent comparison to OpenStreetMap, a massive crowd-sourced dataset of volunteered geographic information.
Available as a raster product and still to be added to Data Download, EDINA are keen to hear if this mapping product is attractive to you as a core offering in Global Digimap. If you have any comments about this new addition, please do let us know using the details below.
Webinar
We are running another short webinar on Global Digimap on Wednesday 9 January from 13:00-13:30 where we will showcase the new dataset as well as talk about the latest developments and additions to the service. There will also be plenty of opportunity to ask any questions you may have about the service and suggest any improvements you would like to see. Places are limited, so please register using the link below if you wish to attend:
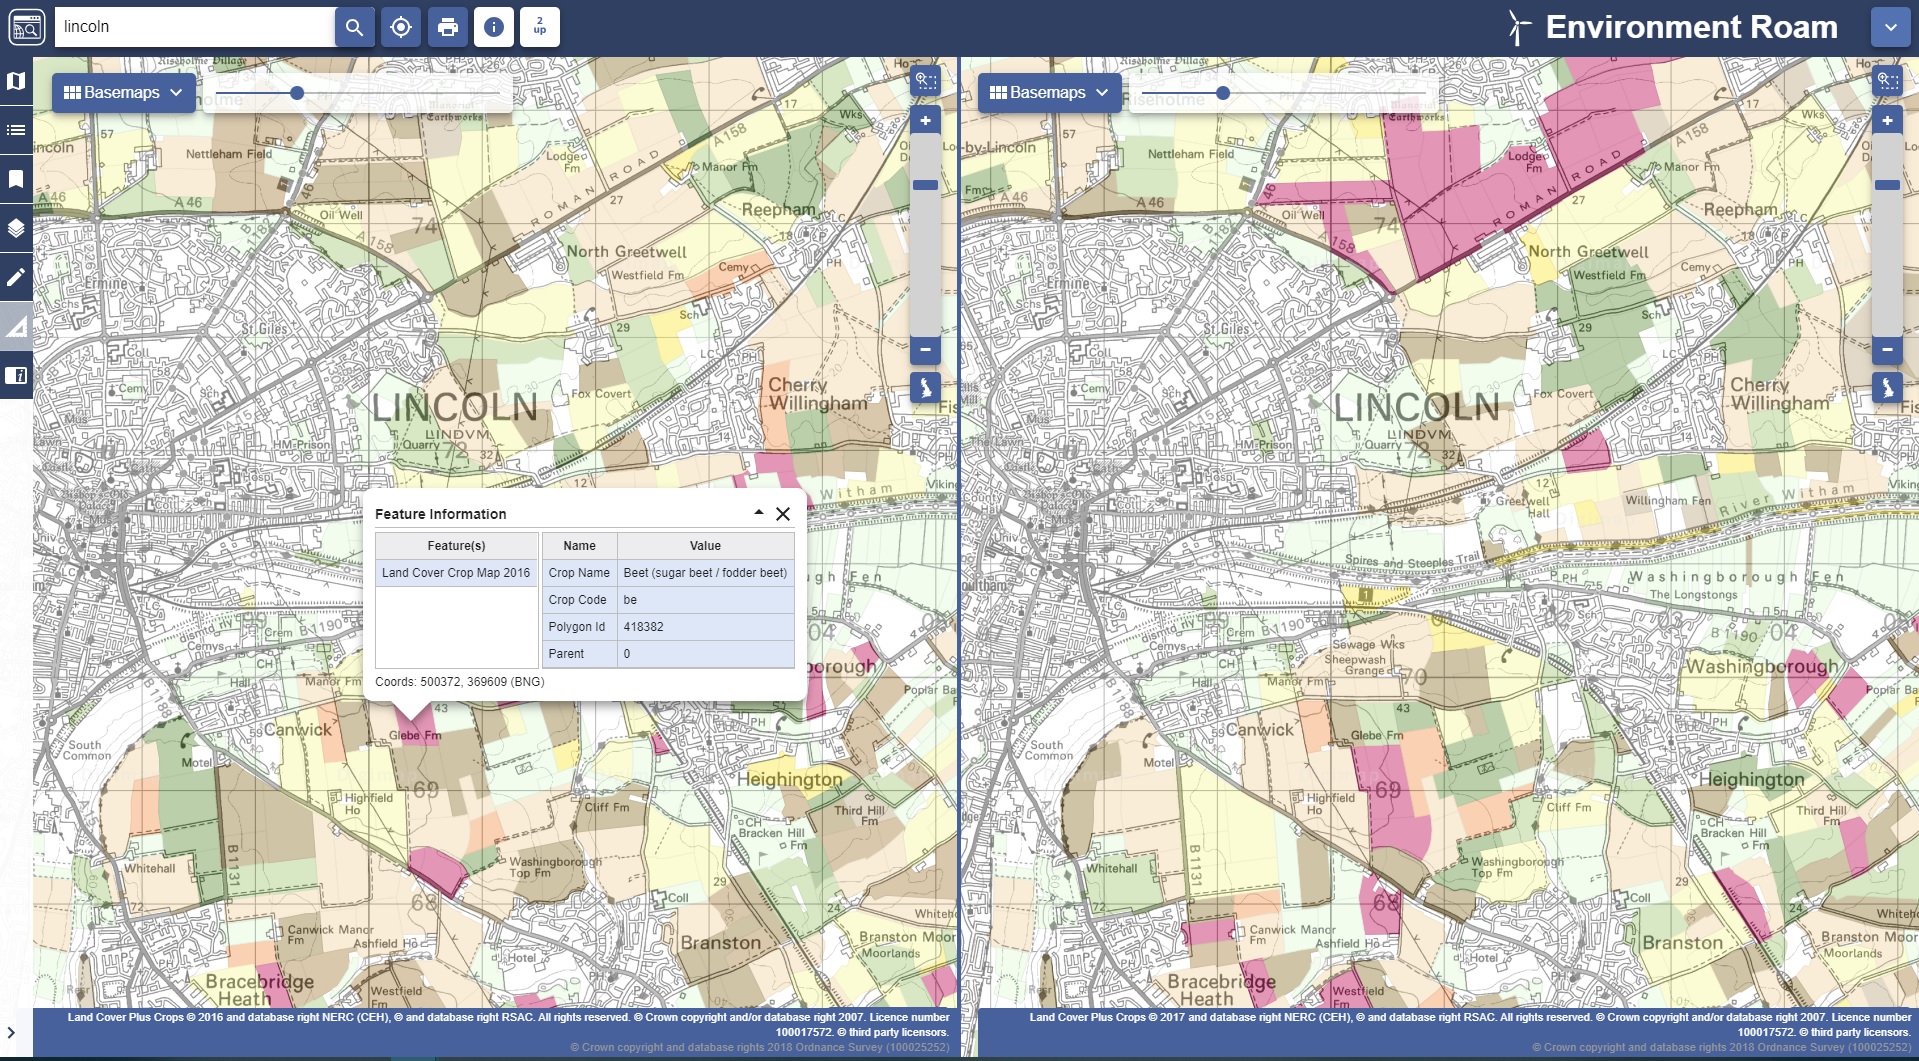
We are delighted to announce that Environment Digimap now offers the CEH Land Cover® Plus: Crops dataset. CEH Land Cover® Plus: Crops has been produced by the Centre for Ecology & Hydrology in partnership with Remote Sensing Applications Consultants and provides annually updated arable crop information for the whole of Great Britain.
Environment Digimap is the only platform dedicated to the academic sector offering this data. CEH Land Cover® Plus: Crops data is available for both 2016 and 2017. Environment Digimap’s Roam application has the new datasets displayed as alternative basemaps, allowing you to compare the two years side by side using the “2-up” map function. The opacity slider also enables the underlying context map to be viewed easily.
The Info Tool also enables you to query the Crops data, giving information about the crop name, code, the polygon identifier and the coordinates of the point chosen. All other functions in Roam operate as usual, including the ability to annotate measure and print. The Map Content is also available in the left hand panel to help you identify crop types.
The CEH Land Cover® Plus: Crops data is also available to download from Environment Download. Select your area of interest as usual, add the Crop data to your basket and select from File Geodatabase or GeoPackage as optional formats. You can also choose to select individual crop layers rather than the full suite if you wish.
If your institution has a subscription to Environment Digimap, this dataset is available at no additional charge. If your institution does not have a subscription to Environment Digimap, prices and details of the subscription process can be found on our website.*
*Please note that in order to place a subscription order you must be a suitably authorised member of staff. If you have any questions about this, please don’t hesitate to contact us.
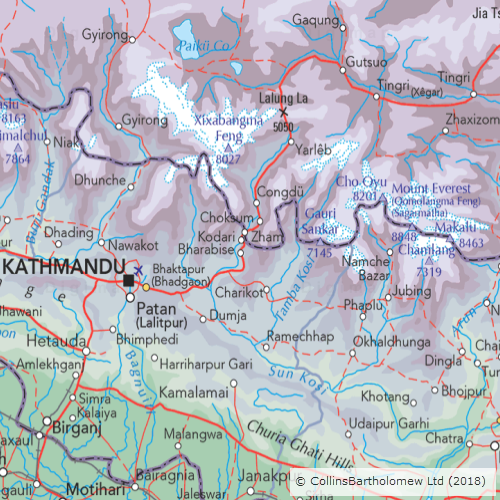
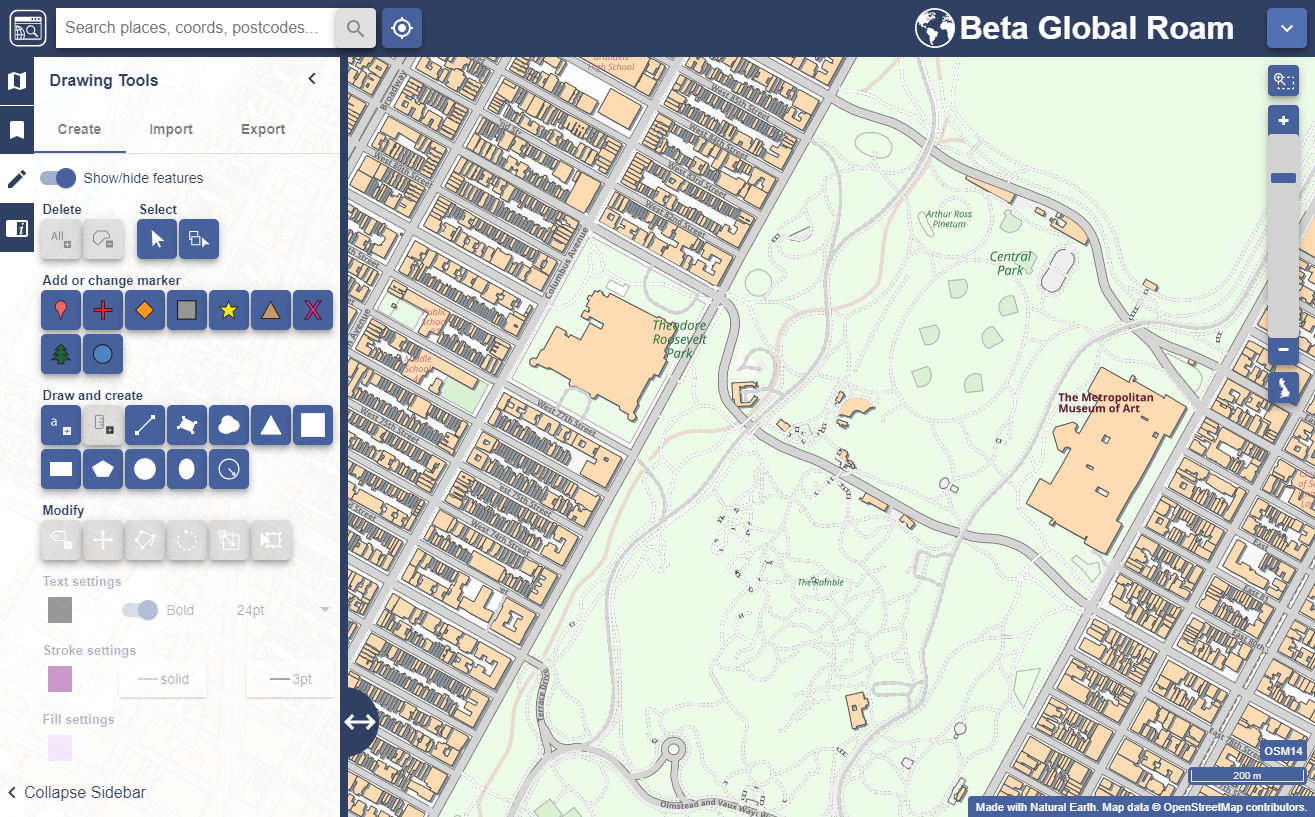
We are very pleased to announce the release of Global Roam. This builds on the release of Global Download last week and allows users to browse global data in the familiar, user friendly, Roam online mapping interface. Global Roam is very much a work in progress and you will find that some of the standard functions are not yet available, but we were keen to get something out to users as soon as possible and we’d love to know what you think of it and where you think it can be improved.
Global Roam showing Central Park in Manhattan
As mentioned in our previous blog post, Global Digimap is available as a beta service as we look to build a suite of datasets, themes and formats that best meets the needs of our users. We will continue to develop the Global Digimap service over the coming months, shaped by the feedback that you give.
Global Roam delivers the familiar Roam interface with detailed global data sourced from Natural Earth and OpenStreetMap. The application includes the usual annotation tools (recently renamed ‘drawing tools’) along with global search functionality. The most zoomed out maps use Natural Earth data which changes to OpenStreetMap as you zoom in. Future plans include:
adding additional data from the rich OpenStreetMap dataset including point features
integrating the print interface to allow high quality printed maps up to A0
addition of the feature information tool allowing users to view the attributes of selected features
creating alternative grey-scale and colour basemap styles
inclusion of the measurement tools [update: these were added 30/08/2018]
customisation of the map through the Map Content panel
It’s worth mentioning that maps saved in Global Roam are not compatible with other Roam clients and vice versa as they use a different projection system. [update: this was resolved 30/08/2018]
Access to Global Digimap
During this development phase, and in return for engagement with the development process, the service will be free of charge for institutions that subscribe to another Digimap Collection. We would like to know what you like and don’t like about it, what features and what new data you would like to see added. We can’t promise to include everything but the more we hear from you the better able we are to prioritise different requirements and create the best possible service.
If you would like access to Global Digimap please ask your local Digimap Site Representative to request access through the Digimap helpdesk and we will ensure your institution is switched on.
Get in touch
It is never too early to let us know what else you would like to see, we are very keen to hear your ideas of how we can make something really useful; our contact details are below:
It is the start of a new academic year and we have introduced few new things for you to see in Digimap:
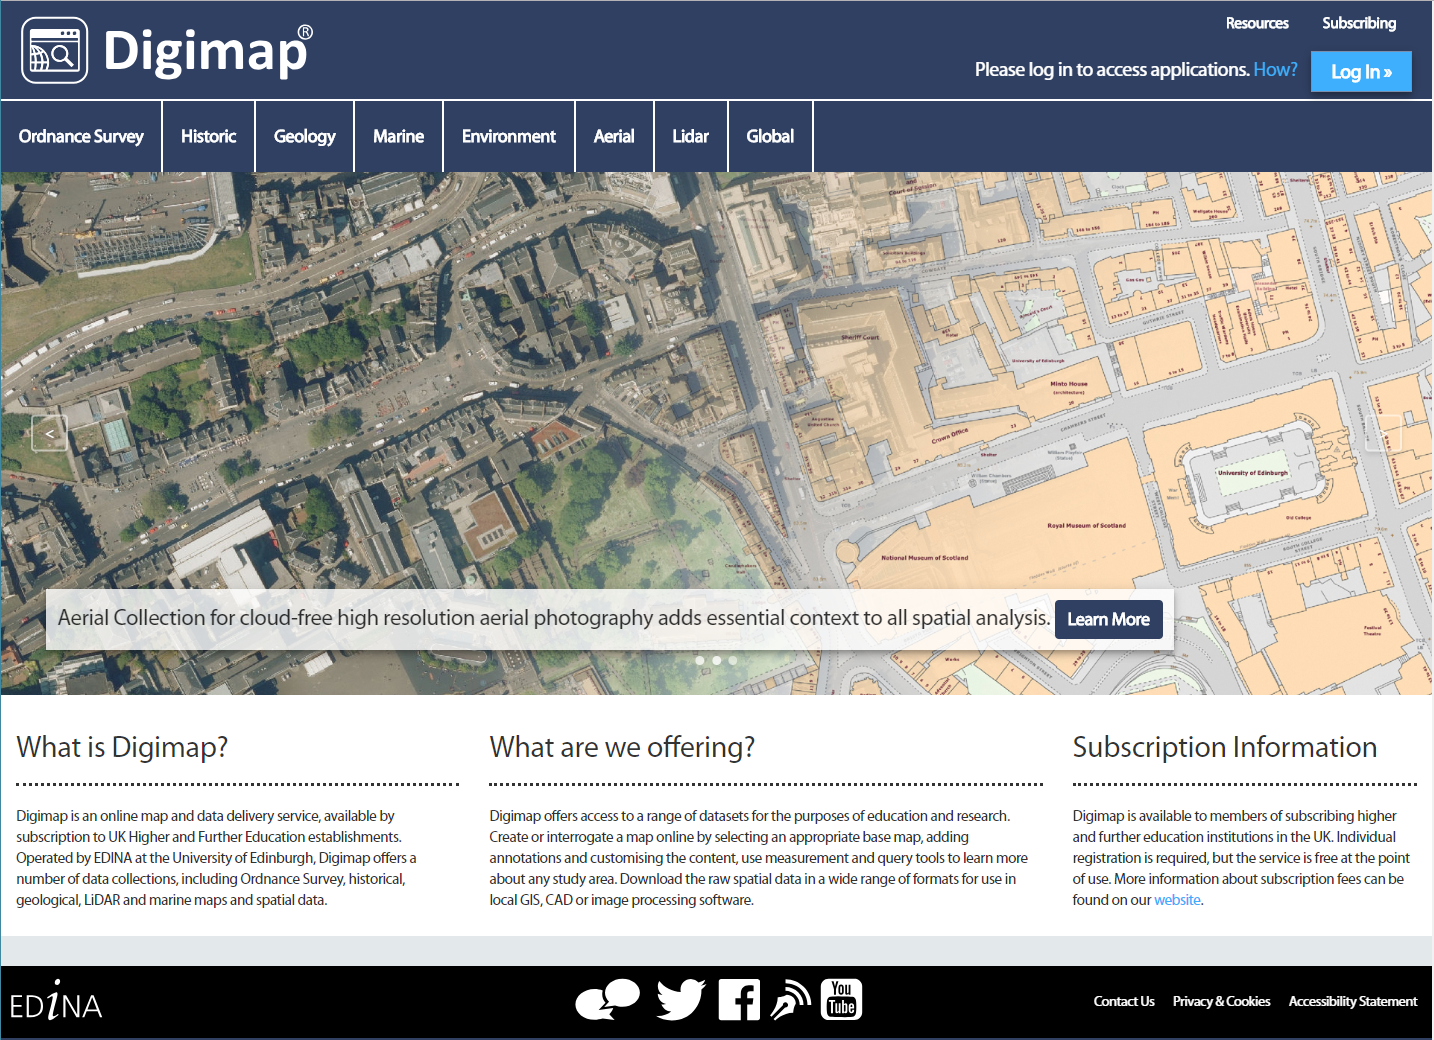
A New Home Page
Digimap has a new home page! It may look a little different, but it works in exactly the same way as the previous version. Responding to feedback from the community we have provided more detail about each collection in the left hand panel, including preview images of the data. Roam and Data Download are easy to find under each Collection’s tab.
Global Digimap
We are very proud to announce the launch of our new Global Digimap collection. This is a new service, developed in response to requests for international data. Initially Global Digimap will offer OpenStreetMap data but our objective is to develop the collection in partnership with the user community, so user feedback will shape both the content and functionality. In return for this engagement, access to Global Digimap will be free of charge until July 2019.
We have asked all the Digimap Site Reps if they would like access to the service, if you can’t access Global Download then speak to your site rep about getting your institution switched on: List of Digimap Site Reps
Following a lengthy beta phase, we have promoted the beta version of Data Download to a production service and this is now the default Data Download application for all Collections. Ever mindful that work flows, and teaching and promotion materials may need updating as a result, we will continue to run the previous versions of both Roam and Data Download until the end of the year. All saved maps and data download histories are available in both new and old versions.
New Licences
Digimap is now operating under new licences for 2018/19 so all registered users are required to accept the new terms. This is a simple process which happens when you first log in. No re-registration is required and all saved maps and data download histories remain available as before.
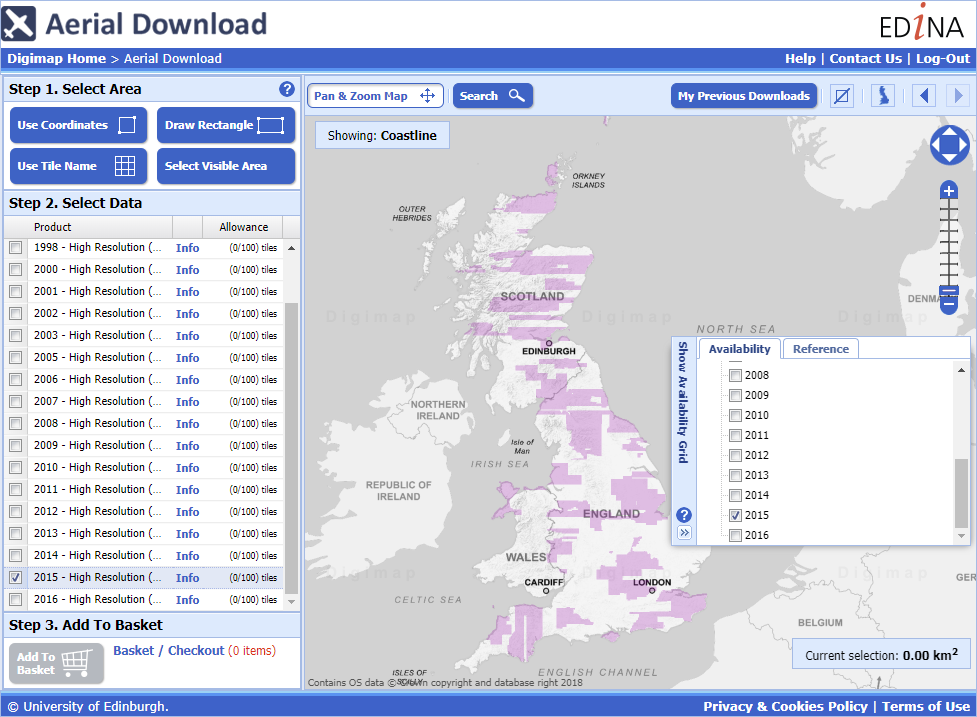
You can now search and download the imagery data from Aerial Digimap by the year it was flown.
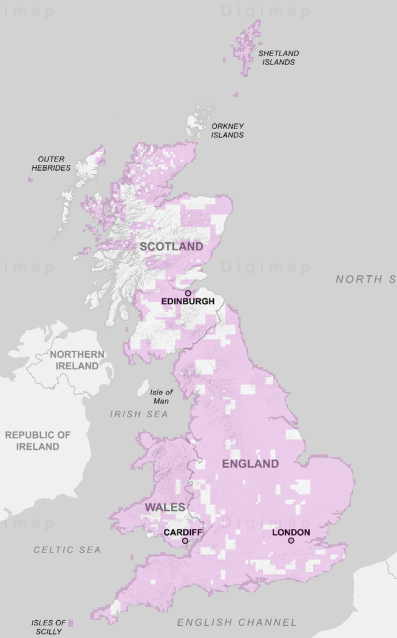
This allows you to be sure that you are downloading only the latest data, but it also allows you to download multiple images for the same location taken on different dates. We currently have data from 1998 through to 2016, with more English and Welsh images coming for 2016. When you are in Aerial Download you can see the extents of each year using the Show Availability Grid tool on the right side of the map as shown in the image above.
There is a table below detailing how many 1x1km images there are for each year, with the majority coming from 2013 to 2016, but some of the older images will be very useful to compare to the newer ones where they overlap:
Year
Number of Images
1998
165
2000
855
2001
891
2002
75
2003
11
2005
423
2006
4,620
2007
7,799
2008
5,757
2009
25,066
2010
35,607
2011
18,642
2012
16,619
2013
54,534
2014
71,404
2015
81,378
2016
18,769
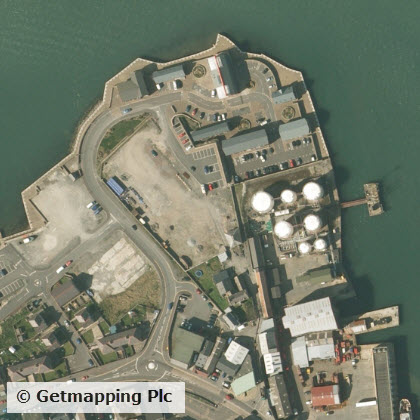
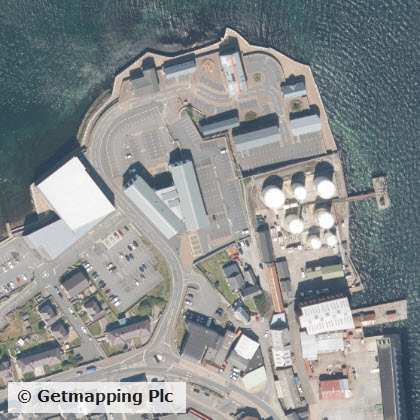
Here are two images of Lerwick taken 8 years apart:
Lerwick 2008 from Aerial Digimap.Lerwick 2016 from Aerial Digimap.
As you can see there has been construction in the West of the area with new buildings and car parks added.
We hope that you find the ability to make this sort of comparison useful for your research. If you have any questions about this or any other aspects of the Digimap service then please don’t hesitate to contact us.
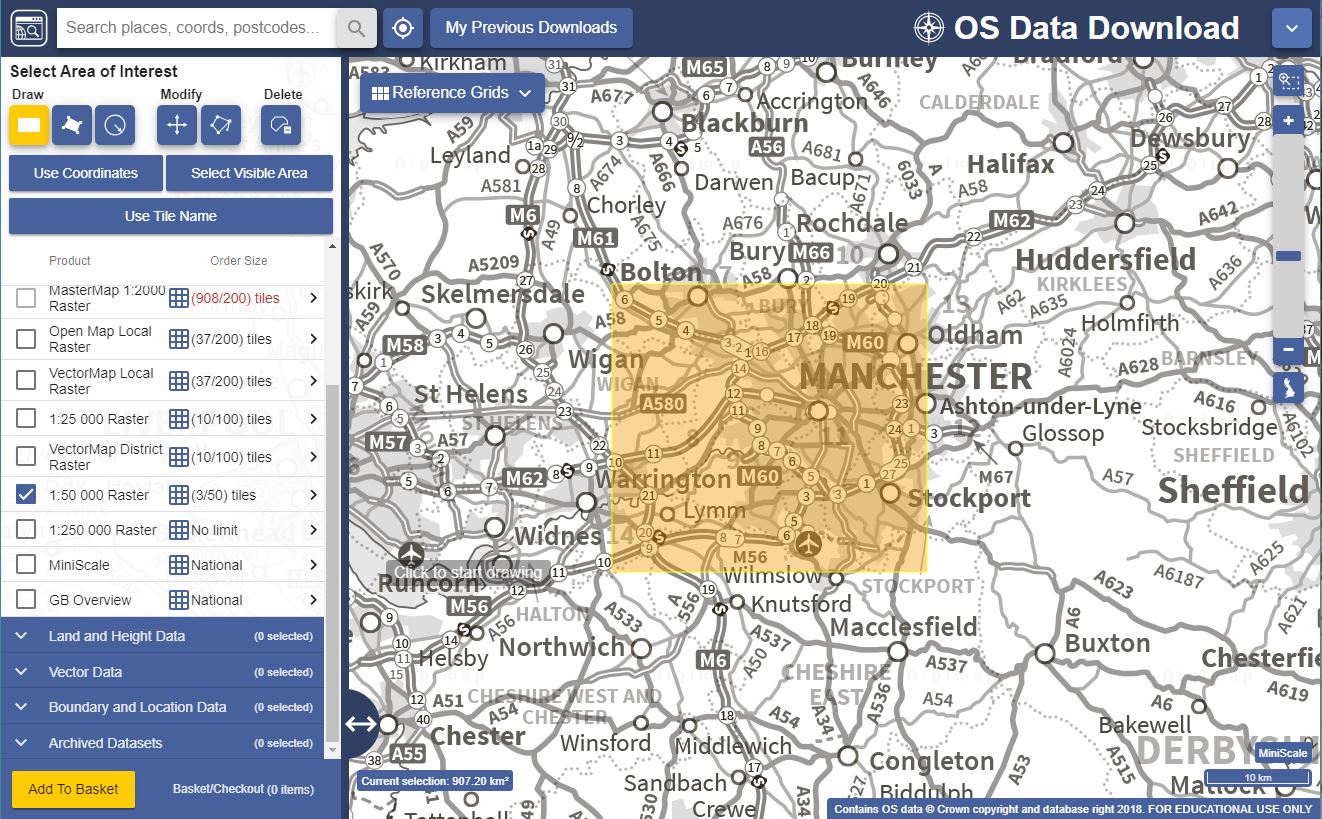
Ordnance Survey have released nearly 5000 extra 5km squares of building height data, with the total coverage increasing from 2578 to 7302. Each square has at least one building with height attributes added, with most fully covered. We have added this data to Digimap’s Data Download facility allowing you easy access to the data you need.
The Building Heights data is available from Data Download in a range of formats created especially for Digimap users. The most straightforward to use are DWG, File Geodatabase and KML which can be viewed directly in CAD, GIS and Google Earth respectively. You can also take the data as a CSV list that can be joined to the attribute table of any existing MasterMap Building data you have, using the TOID identifier. This means that you don’t have to recreate your project work with new data if you have already spent a lot of time working on it; as long as the buildings still have a TOID in their attribute data you can add the height information to it.
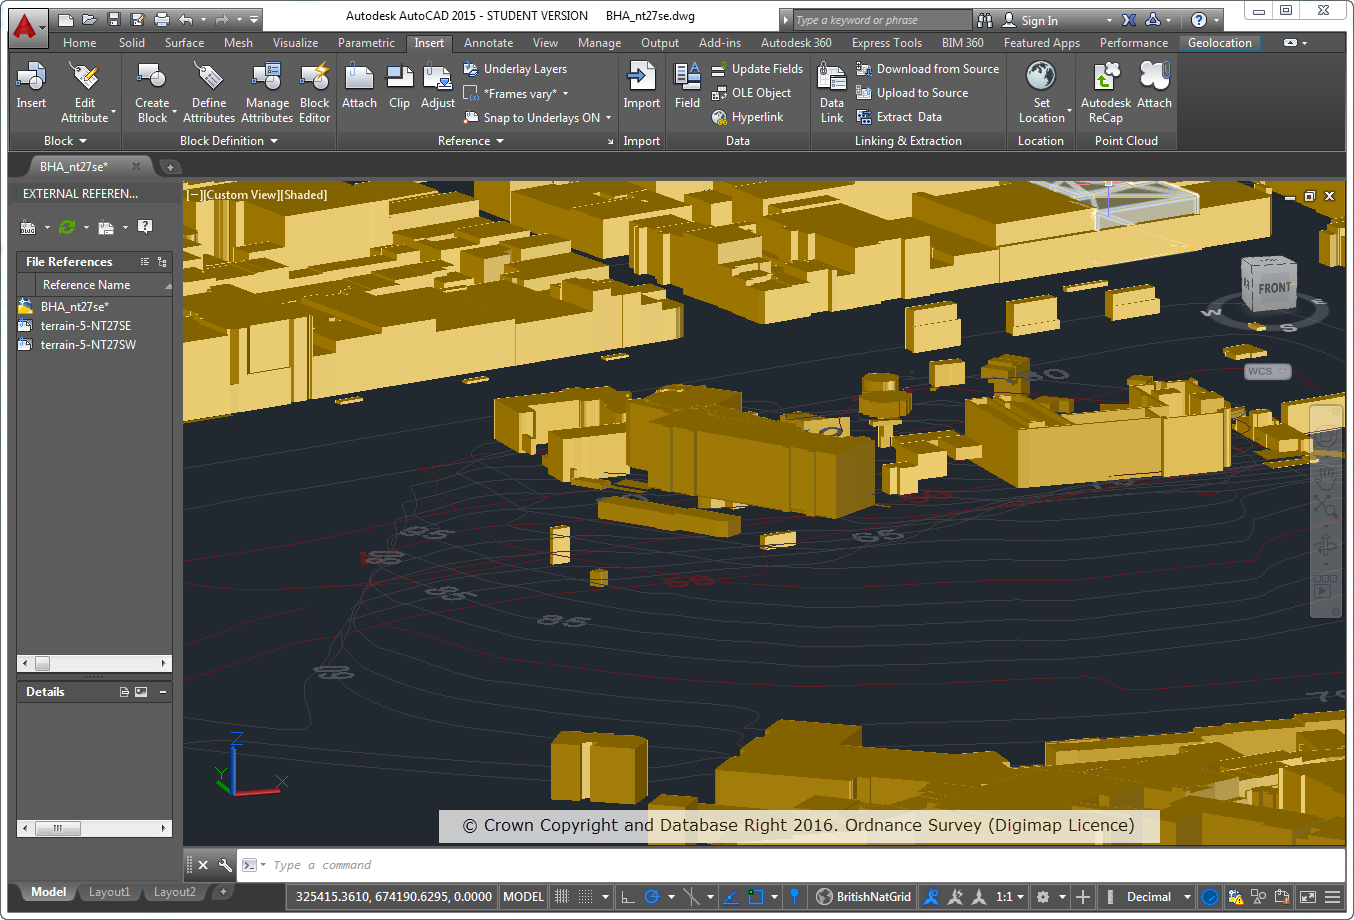
The Building Heights data is ideal for anyone working with the MasterMap data in 3D and has a range of applications in Architecture, Landscape Architecture, Environmental Modelling, Archaeological Reconstructions and many more different disciplines. Here are a couple of examples:
OS MasterMap Topography Layer Building Height Attribute data on top of OS Terrain 5 Contours
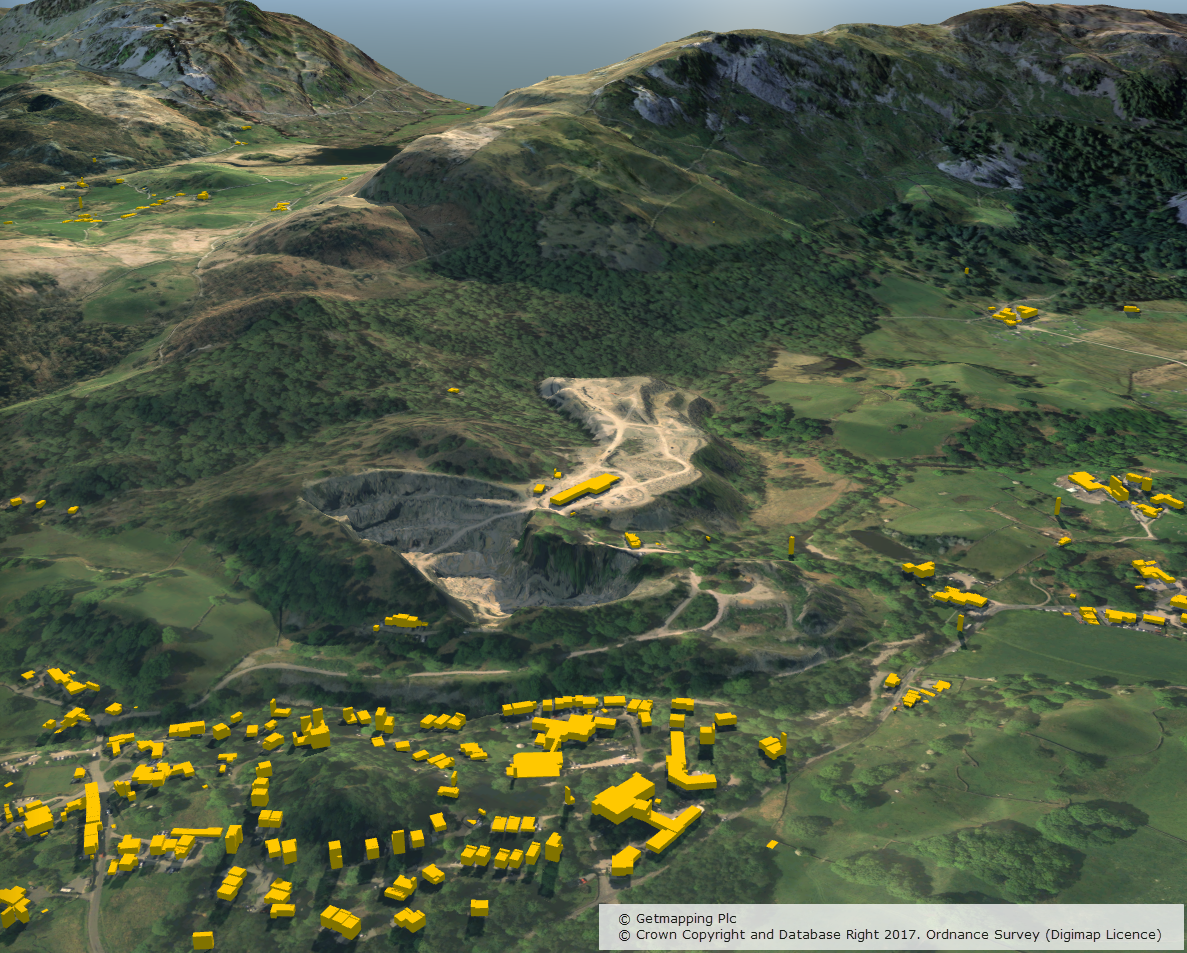
3D model using Aerial Imagery, OS Terrain 5 DTM and MasterMap Building Heights Data