
 All Digimap Download facilities should be considered ‘at risk’ next Tuesday (26th April) due to some essential hardware maintenance. MasterMap Download will take longer to process orders on this day so it would be wise get these in beforehand if you have deadlines to meet.
 Author: ecls

Digimap for Schools wins Gold Award
EDINA are delighted to announce that the new Digimap for Schools service has been awarded the GOLD Certificate for the best overall resource in the the Geographical Association’s 2011 Publishers’ Awards.
The GA Publishers’ Awards aim to recognise material which is likely to make a significant contribution to geography in primary schools, secondary schools or colleges, and to encourage the creative development of new materials. Further information about the awards can be found here: http://www.geography.org.uk/news/publishersawards/
The Award was presented at the Geographical Association’s Annual Conference at the University of Surrey, Guildford on Thursday 14th April 2011 to EDINA’s Director Peter Burnhill and Ordnance Survey’s Director General and CEO, Vanessa Lawrence.
Peter Burnhill said, “This Gold Certification from the Geography Association Publishers is splendid recognition for all those who have worked together on Digimap for Schools to bring Ordnance Survey mapping into the classroom.
“At EDINA, which is based at the University of Edinburgh, we aim to live up to your expectations and do for primary and secondary schools what we have done so successfully for universities and colleges, encouraging love of maps as well as helping to prepare students for the future.”
About Digimap for Schools
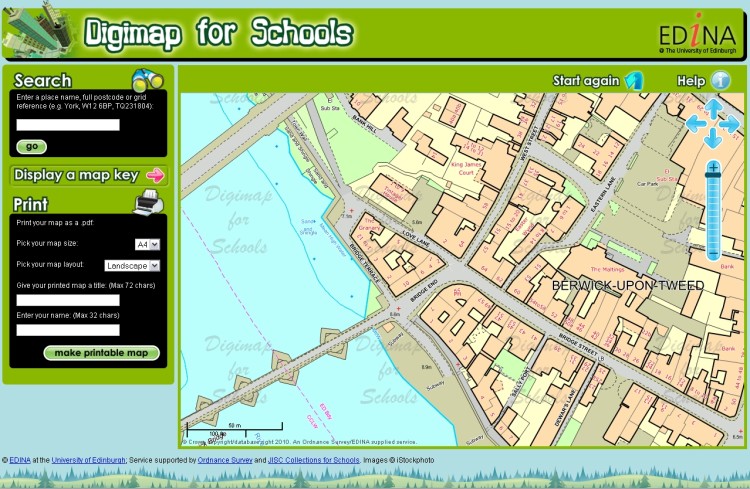
Digimap for Schools is a joint venture between EDINA (University of Edinburgh), Ordnance Survey and JISC Collections and provides easy access to a wide range of current Ordnance Survey maps including national coverage of OS MasterMap, Landranger and Explorer series. Also included are street level maps showing street names and road-atlas style maps.
Subscribing schools can use a seamless digital map of Great Britain at each scale available. Maps can be printed as PDF files at A3 or A4 size and in landscape or portrait orientation. Maps can be printed with an individual’s own map title and name included with the scale bar and school name and address. Search tools include postcode, place name or national grid reference and maps can be moved to centre on any chosen location within Great Britain. Map keys are available for each scale map to explain the symbols used within the map.
For information about Digimap for Schools, how to subscribe and links to a free trial demonstration version of the service, please check the following links:
- http://digimapforschools.edina.ac.uk/about.html
- http://digimapforschools.edina.ac.uk/subscribe.html
- http://digimapforschools.edina.ac.uk/demonstration.html
Data Updates: OS MasterMap and VectorMap District
OS MasterMap Data Update
The MasterMap data in Digimap’s MasterMap Download has undergone its April update; the new data has a currency date of January 12th 2011. The data is available to download for new orders, re-orders of previous data, and as a Change-only Update (CoU) which provides only the changes to the data since it was downloaded.
CoU and Re-orders can be accessed from the Your Account page in MasterMap Download; simply select the order you want to refresh and use the CoU or Re-order (current data) buttons below the order list.
Please note that the OS MasterMap raster data (Tiff files) in Digimap’s Data Download are only updated once a year in September. You can read about these maps in a previous blog post here: MasterMap Background Maps
VectorMap District Beta Release
VectorMap District data has now been updated from the alpha release to beta in Data Download. You can read about the differences in a previous blog post here: VectorMap District beta release
The currency dates for all the different data products in Digimap’s Ordnance Survey Collection can be found on the following help page: Dates of Updates to Digimap
New Features in Digimap Roam
Measurement Tools:
Digimap Roam has new measurement tools that allow you to easily check the distance between two or more points and find out the area of a polygon you draw on the map.
Click on the ![]() icon above the map to activate the tools. Select Distance or Area then start clicking on the map to define your line or polygon; use a double click to finish.
icon above the map to activate the tools. Select Distance or Area then start clicking on the map to define your line or polygon; use a double click to finish.
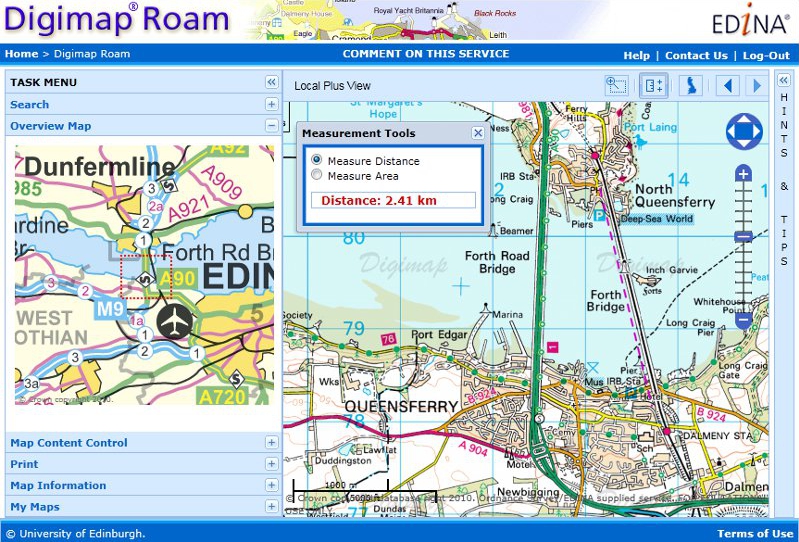
New Local Plus View:
Digimap Roam has also got a new zoom level to go with the measurement tools, bringing the total to 13. The view, called Local Plus, is a more zoomed out view of the 1:50,000 colour raster maps found in the Local view. The image above uses this new view as well as the measurement tools.
The Local Plus view prints at 1:40,000 compared to 1:20,000 for the Local view.
The New Digimap Blog
This is the new Digimap blog and replaces our old Blogger site. From now on this will be one of the places that the Digimap team post news, information about updates and other useful things like tip and hints. You can subscribe to the blog through the RSS feed:
http://digimap.blogs.edina.ac.uk/feed/
If you find a link to our old blog, please inform the administrator of the site that you found it on, or send us the URL and we will try to contact the site owner to get the link updated.
Firefox 4: compatability with Roam
Mozilla have just released their latest web browser: Firefox version 4.
EDINA is aware that while the majority of functionality within Digimap will work with Firefox 4, you may find that you need to restart the Roam mapping services, and sometimes their print facilities, to get them to work properly. The problem is due to the underlying software we use to make maps not yet being compatible with Firefox 4; usually after reloading everything works smoothly.
![]()
Please bear with us while we make the necessary updates to ensure that Digimap is fully compatible with Firefox 4. If you cannot get any aspect of the service working properly then please contact the help desk: edina@ed.ac.uk
VectorMap District – beta release
Ordnance Survey have recently release the next version (the beta version) of their VectorMap District product. This dataset is part of the OS OpenData package.
You can read more about the changes to VectorMap District on Ordnance Survey’s blog.
EDINA will be updating the version of VectorMap District available through both Digimap’s OS Collection and Digimap OpenStream. The current (alpha) version will be withdrawn completely.
There is some processing work to be done on VectorMap District before it can be available through EDINA’s services. With this in mind, we aim to release the new version through Digimap’s Data Download facility on Tuesday 5th April and through Digimap OpenStream by Thursday 31st March.

Facebook Poll – Which GIS?
![]() We are running a poll on our Facebook page to see which GIS is the most widely used by Digimap users.
We are running a poll on our Facebook page to see which GIS is the most widely used by Digimap users.
Go to this page to let us know which one you use the most: GIS Poll
OS MasterMap background maps
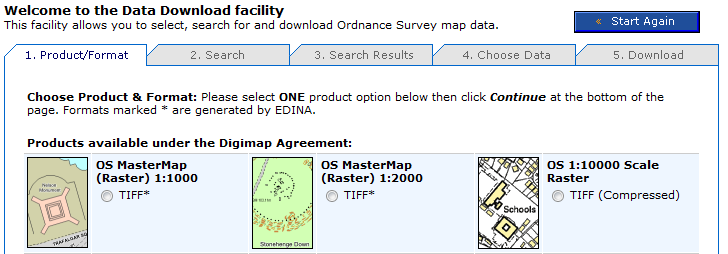
OS MasterMap data is now available to download in a rasterised (image) format from Digimap’s Data Download facility. If you need an image of OS MasterMap data (for example, as a backdrop map) but don’t need the complexity of the original vector data, this new stuff is for you.
OS MasterMap – detailed but complex
OS MasterMap is the most detailed product offered by Ordnance Survey. Maps made with with OS MasterMap have been available through Digimap’s mapping facilities since 2007, but if you wanted to use OS MasterMap as background for a customised map by overlaying your own data in a GIS you needed to download and convert the raw GML data. If all you want is a detailed colour background image, this seems like a significant investment of time.
Rasterised OS MasterMap – images not data
Digimap now offers OS MasterMap as .tif images at two scales: 1:1000 and 1:2000 through the usual Data Download facility. This saves you having to download, convert and import the data using specialist GIS software.
Where do I get the OS MasterMap raster background maps?
Log in to Digimap’s OS Collection, go to Data Download and select which scale of OS MasterMap image you want from the list of products. The images are tiled in 1km square tiles, so you can select your area of interest, and the tiles covering it, in the same way as other tiled datasets.
The scales are determined according to the distance on the ground represented by each pixel. The larger scale images are based on a measurement of 0.3125m per pixel. The smaller scale images are based on a measurement of 0.625m per pixel. These equate to approximate scales of 1:1000 and 1:2000 respectively, although these are dependent on the screen resolution of your monitor. You can easily display the maps at other scales, but some loss of image quality may occur if you do.
“How To” Videos on YouTube
![]() We have created some “How To” video clips and put them on YouTube for everyone to view. They show how to carry out various tasks with Digimap’s online maps and downloaded data.
We have created some “How To” video clips and put them on YouTube for everyone to view. They show how to carry out various tasks with Digimap’s online maps and downloaded data.
You can see all the videos on the EDINA Digimap YouTube channel: http://www.youtube.com/user/EDINADigimap
If there are any particular aspects of the service for which you would like us to make a video, you can add them to the discussion on our Facebook page or email us directly at edina@ed.ac.uk.