
Glimmer of hope XIX
UK and Scottish coronavirus mortalities: how many more deaths will there be?
Summary
The UK and Italy have been following very similar COVID-19 pathways. Italy being 15 days ahead, the UK with worse mortality rates. Taking data from the cruise ship Diamond Princess at face value Neil Ferguson’s intervention, which altered the course of the outbreak in the UK, could well have saved 19,000 Scottish lives, rising to a quarter of a million across the UK as a whole.
Background
The coronavirus disease 2019 (COVID-19 for short) was first identified in Wuhan province China in December 2019. DNA analysis of a sample from an early patient has led virologists to conclude that the virus first arose on, or around, 24th November. Originally believed to have developed in bats or pangolins, genomic comparisons now suggest the virus is the result of a recombination of two different viruses. COVID-19 has since spread around the world causing countless deaths and economic mayhem. Modelling is central to forecasting its further spread, devising more effective counter measures, freeing up the global economy, determining vulnerability to a second wave and driving governmental policy.
Simple COVID-19 models
There are three key modelling approaches used to forecast COVID-19 trajectories: epidemiological, agent-based and curve-fitting. As we will see my preference is for the curve-fitting variety. Ideally any model adopted needs to be simple and yet complex enough to capture all the most important effects.
Epidemiological and agent-based
Even the least involved, general purpose, epidemiological models require a considerable number of parameters in real life settings. Worse still, many of the parameter values need resetting through the event, e.g. as new intervention measures are brought in. The classic SIR model (Susceptible (not infected, but not immune), Infectious (infected and contagious) & Recovered (no longer infected, and now immune to infection, or dead)) is a mathematically elegant triad of equations. SIR simulates the passage of individual people through the main three phases (S -> I -> R) of an epidemic. Clive Best provides a lucid description of a stripped-down SIR. A worrying defect of SIR models is that they can be extremely sensitive to small changes in either their assumptions or their parameters. Slight differences can be magnified in the modelling and in turn lead to strong disagreements between epidemiologists. Agent-based models follow the interactions and spread of a disease amongst individuals (“agents”) within a community. The model requires rules governing movement, mixing patterns, behaviours, risks, health interventions, policies, and so on. Again agent-based models are necessarily quite complex.
Curve fitting
When trying to forecast the timing, or magnitude, of the peak of an epidemic, or the rate of decline of the tail, or the total mortality at the close of the first wave then I prefer a curve-fitting / mathematical-projection approach. In particular I find it helpful that there are fewer parameters to determine. This parsimony is particularly important given the poor reliability of the information we have at present on COVID-19.Throughout this series of blog pages I have been using a well-tested, curve-fitting approach, first used by King-Hubbert to study peak oil, and then modified slightly by Clark & Thompson to model the somewhat more intricate patterns of flowering curve trajectories. Technically I employ a generalised, skew-normal, with five unknown parameters. These five parameters have to be determined (“calibrated”) from the available COVID-19 data.
Back-of-the-envelope
Simpler still are back-of-the-envelope computations, based on down-to-earth concepts such as ‘how many people could become infected’ and ‘how many people is the virus capable of killing’.
Results
Let us look at the differences found when estimating casualties using two simple approaches, namely: Model 1: Back-of-the-envelope and Model 2: Curve-fitting. For Model 1 all we need to know are three numbers, and all we need to do is multiply them together. That sounds straight-forward. Better still, one of the three numbers is extremely well-known. The problem is the other two numbers are uncertain, despite a number of countries and provinces having already completely passed through the first wave of the COVID-19 pandemic. The three crucial numbers are total population, deaths after infection (i.e., case fatality rate), and the proportion of the population who become infected. We have
N(dead) = P(population) x CFR(fatality rate) x I(final fraction infected)
- First number: for the UK, N=66,796,807 in mid-2019, for Scotland N= 5,463,300.
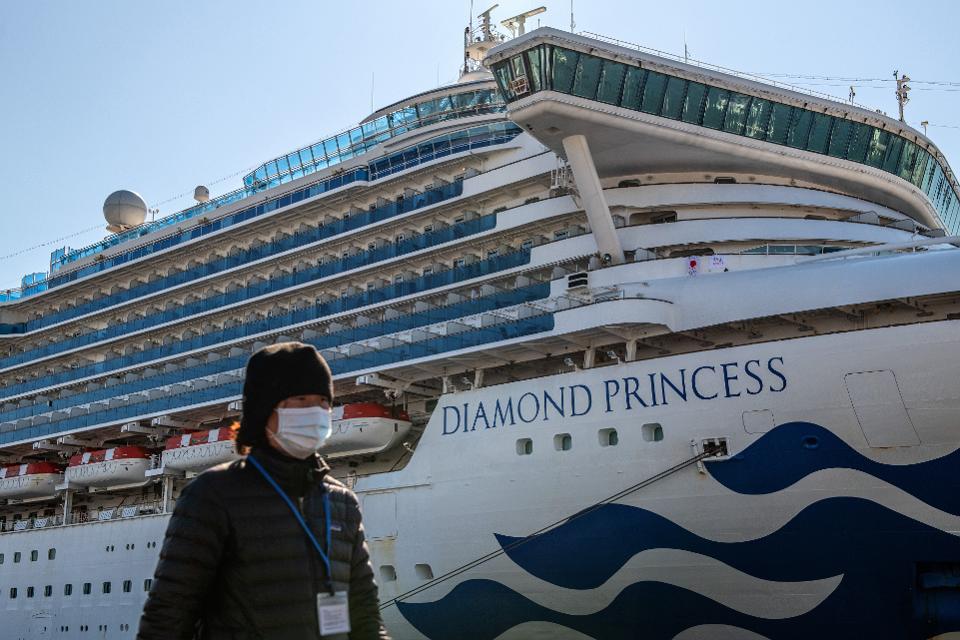
- Second number: CFR, the number of people who succumb after being infected. This number is still hotly debated. However there is one neat, self-contained, easy-to-understand dataset that can help. The cruise ship Diamond Princess presents us with an “experiment of opportunity”. 3,711 passengers and crew were quarantined for a month. They all lived together along with COVID-19. No-one entered (unlike at Heathrow today), no-one left. In effect the ship became a living laboratory. More than 700 people were infected, 12 of whom died. Importantly almost everyone was tested, some people more than once. Combining the cruise ship data with additional information from Wuhan province in China yields a CFR of roughly 0.5%.
- Final number: all we need now is a value for I, the proportion infected. I will assume that in the absence of a viable vaccine that herd immunity will eventually be reached. It is agreed that 70 to 90% of a population have to become immune for effective herd immunity to operate. I will use the middle of the road, 80%.
So there we are, in the absence of a vaccine in the UK 267,187 (= 66,796,807 * 0.5% * 80%) people will die directly from COVID-19, and many more will die from numerous indirect effects (e.g. delayed hospital treatment, avoiding visits to GPs, mental health problems, welfare resources being diverted into other areas.)
In Scotland the total number of mortalities caused by COVID-19 works out as 21,853 people (= 5,463,300 * 0.5% * 80%) from direct effects alone.
Model 2: Forward projection using curve fitting
What about the second modelling approach? Using my skew-normal maths (lower panel in figure below) I project UK deaths (in hospitals) by the close of COVID-19’s first wave will total 41,362.
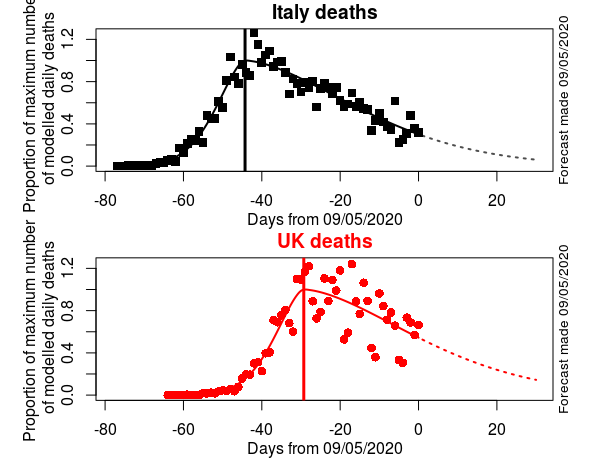
Comparison of curve fitting of Italian and UK deaths trajectories. (Daily deaths as reported in ECDC database). Dashed lines forecasts using 5-parameter skew-normal model. The trajectories of the two countries have remained remarkably similar in general shape, duration and skewness. Italy, on average, has been 15 days ahead. The UK populace has had to suffer a worse number of deaths per capita. Italy is modelled as peaking 34 days after the first recorded death, the UK 35 days. There is no sign of the Italian, or the UK, epidemics departing from the type of progression I have been forecasting over the past weeks of a skewed normal. Conclusion: watch Italy if you want to know how the UK epidemic is likely to progress.
But hang on. That model 2 total is much, much lower than the total derived in model 1. What went awry? Why is the gap so wide between these two rather straightforward approaches? Can the undercounting of deaths in hospitals (for a long time the official UK approach) account for the difference? No.
Instead we have arrived at the heart of an ongoing epidemiological debate, i.e., the notorious “Oxford vs. Imperial College” dispute. Put simply, what proportion of the population has been infected? In particular is it a high proportion (as claimed by workers in Oxford & Stockholm) or a rather modest proportion (as claimed by Imperial College & Harvard)?
In short, my Model 1 with 267,187 UK mortalities can be thought of as the “herd immunity” or “Oxford” strategy that the UK Government at first decided it would actively pursue. Model 2 with 41,362 deaths is the “U-turn” or “Imperial College” strategy that Prof. Neil Ferguson had to fight hard to get the UK Government to accept. By delaying peak and flattening the curve Imperial College allowed the NHS to be able to perform better than the medical staff on the Diamond Princess. Time has been bought to develop a vaccine before herd immunity is reached. Time has been bought to introduce a tracing app that can reduce transmission by asymptomatics who don’t realise they are infectious. The difference between the two models (267,187 – 41,362 = 225,825) gives my estimate of the minimum number of UK lives that will potentially been saved. Of these roughly one quarter of a million souls over 19,000 are still alive in Scotland today.
The question remains: will future UK governmental policy favour lives before livelihoods? Or alternatively will the UK and regional Parliaments lose focus and unlock too early thereby causing the epidemic to re-emerge in a series of additional oscillatory waves or worse cause an even larger 2nd peak? Time will tell.
Conclusion
Personally, being in a higher-risk category, and having little faith in the UK Government’s level of understanding of COVID-19 ever improving, I am not planning to emerge from stringent self-isolation or from my fervent hand-washing any time soon.


Can you split out the Scotland data (Hospitals plus care homes plus excess deaths above annual typical) to demonstrate if there isa difference in decline between England and Scotland. Thus if Scotland is a slower decline on infection rate or of death rate, then decision stay locked in is absolutely correct based on numbers. And If then compare with Sweden, “go out but try to not get too close” policy, does the UK approach have any real effect. Or are will the UK inexorably accumulate 267,000 UK deaths during the next 12 months as an un-announced herd immunity policy?
Stuart, The Scottish data remains very problematic. Huge weekend effects due to delayed reporting of deaths. Small data sets. Lack of clarity over exactly what is being reported. In addition many more assumptions need to be made to extract a sensible Scottish model. Hubbert fits need to be based on robust regression rather than ordinary least squares to try to remove huge biases from annoying Scottish outliers. My advice to Nicola would be to apply the precautionary principle, when devising her exit tactics for Scotland, as so much scientific knowledge on the Scottish situation is lacking or inadequate.
Hi Roy Great blog entries and wonderful to see back-of-envelope calculations! Oxford are saying that the infected fatality rate % (all ages) is between 0.1 and 0.41%. The lower end of this range applied across the UK would bring the number of total predicted deaths much closer to your model estimates (especially if you accept an 80% herd immunity figure i.e. 0.001 x 66000000 x 0.8 = 52800). Of course, given 32000 deaths already, I think this would mean that 48% of the population (i.e. (32000/0.001)/66000000) has already been infected – and this seems too many. Strikes me that we could constrain some of these figures by asking the whole population to state whether they think they have been infected?
John, The Zoe app is doing exactly what you suggest. 3,528,807 participants have downloaded the app and are using it to regularly report on their health, making it the largest public science project of its kind anywhere in the world. Despite all that data the analysts are still to come up with a percentage of the whole population that has been infected. Hopefully they will pronounce fairly soon.
Website
Hi Roy, couple of things:
1. Any evidence of getting extra hits due to including the phrase “stripped-down SIR”?
2. I like your Diamond Princess experiment of opportunity – but don’t you need to somehow correct for the difference in demographics between the cruisers (presumably older, richer, better-fed, whiter, etc.) and the UK/Scottish population?
Cheers, David
David,
1. One does get quite a few comments from young Russian girls with an unusually healthy attitude to science. They generally (perhaps always) include a helpful http: link for your readers to visit. But none so far have noticed the phrase “stripped-down SIR” in this posting.
2. Yes, the Diamond Princess demography is important. But very difficult to deal with satisfactorily. At present I am trying to estimate how far Scotland is along the path to ‘herd immunity’. To achieve this aim, in addition to Scottish deaths and symptomatics time-series, I need to build two additional pieces of information into my model: case fatality ratio (CFR) and the proportion of asymptomatics. The Diamond Princess can provide these metrics, but – as you point out – correcting the criuse ship data in problematic. Emery et al. suggest 72% asymptomatic, Mitizumoto 17.9%. Worse still other studies give yet more values for this critically important asymptomatic parameter. Asymptomatic patients – who may serve as a reservoir and contribute to the spread of the disease – made up a reported 30% of cases in South Korea, 17.9% (or 72%) on the Diamond Princess cruise ship, 60% on the Greg Mortimer cruise ship, and 50%–75% in Italy. Can the bulk of all that variation be caused by demography? Maybe. If so what percentage value is sensible for the Scottish population? Despite all these types of difficulties I still like simple models – at the very least they can focus your attention on the key (missing) information that needs to be born in mind when policy decisions are to be made. (See letter in The Telegraph by Richard Ennos: ).