
COVID-19 and the Edinburgh congestion charge
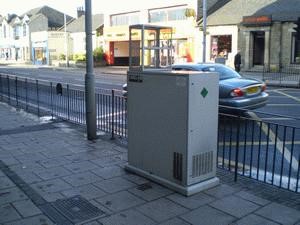
Edinburgh St John’s Road air-quality monitoring site. ID: ED1
| Environment Type | Kerbside |
| Coordinates (Lat/Long) | 55.942500, -3.281111 |
| Altitude | 53m |
| Kerb Distance | 0.5 |
| Site Comments | The nearest road is 0.5m from the site. |
Summary
Good news. Concentrations of pollutants, especially those mainly emitted by road transport have shown a sharp drop in many European cities, including Edinburgh, during the COVID-19 crisis.
Question
Can we turn the crisis to our advantage to discover more about traffic levels and air-quality in Edinburgh?
Preamble
Before the COVID-19 lockdown Edinburgh was named the ‘worst city in Britain’ for traffic congestion. Leading sat-nav specialist, TomTom, has tracked journey times all around the world. They find that Edinburgh journeys take 40% longer during rush-hours. This was the worst result for any UK city. London averaged 37%. The TomTom statistic alone is a good argument for taking a second look at congestion charging in Edinburgh as I urged previously in a letter published in the Scotsman in January.
Do you want to be a referee?
The COVID-19 lockdown is generating a huge amount of fascinating data on all sorts of scientific, behavioural and social topics. So much so that there is going to be a worldwide shortage of referees to peer-review an anticipated avalanche of manuscripts. Journals are seeking reviewers in all fields to help with this developing crisis by agreeing to review manuscripts within 24 to 48 hours. You can sign up to be a referee here! Let’s look at one small example of the type of study that COVID-19 is making possible – air quality in Edinburgh.
Edinburgh
Air pollution in cities is a serious environmental problem. Edinburgh is no exception. The graphs below aim to illustrate the scale of Edinburgh’s air quality problem. The diagrams have been chosen to highlight improvements in air quality resulting from reduced road traffic during the period of COVID-19 travel restrictions.
A little care is needed because not all traffic ceased. Trips made by food delivery vans increased. Furthermore it is worth noting that other factors than the lockdown restrictions, such as weather conditions or road closures, can effect pollutant concentrations. For example the UK has just seen the sunniest April since 1929. It has also been a relatively warm and dry April. All these conditions were a result of persistent high-pressure systems hovering over or close to the UK since late March. Seasonal trends in pollutants are also likely. These can include a seasonal photochemical component, a seasonal emissions component (more traffic, less domestic heating) and a seasonal meteorological component (causing changes to atmospheric boundary layer thickness). Nonetheless, the unprecedented step change in circumstance of COVID-19 produced such a sharp improvement in air quality that no mathematical corrections or modelling techniques were found to be needed to demonstrate the effect.
St John’s Road, Edinburgh
Emergency ‘lockdown’ legislation aimed at curbing the spread of coronavirus through traffic restrictions was passed at Westminster on March 25th. The Bill received Royal Assent later that Wednesday afternoon. Scotland’s traffic had effectively stopped by that evening. What a law-abiding nation we are!
Both graphs below chart pollution as measured on St John’s Road, Corstorphine as part of the Scottish Air Quality Network. The data is made available via Ricardo Energy & Environment. Edinburgh St John’s is a roadside site (see photo and table above) so traffic is likely to dominate measured NO (nitrogen monoxide) and NOx (chemical shorthand for molecules containing one nitrogen and one or more oxygen atoms). Examination of plots of hourly data reveals both NO and NOx concentrations falling after lockdown at St John’s Rd. I also find the same effect at many other sites across Scotland including Dundee_Seagate, Falkirk_Hope St., Fife_Cupar, Glasgow_GreatWesternRoad, Stirling_Craig’sRoundabout, and West.Lothian_Linlithgow.
The first graph summarises the hourly data by plotting month (on the x-axis) vs hour of the day (on the y-axis), throughout the last 16 months. High values of nitrogen monoxide (NO, or nitric oxide) are shown in deep red, low readings (< 15µg m-3) in dark blue. The vertical line of 24 blue squares at the extreme right reveals how there has been an impressive reduction arising from lessened traffic flow in April. Note how the drop occurs at every single hour of the day (in all 24 blue squares). The overall average concentration in the month of April amounted to only 4.48 µg/m3.
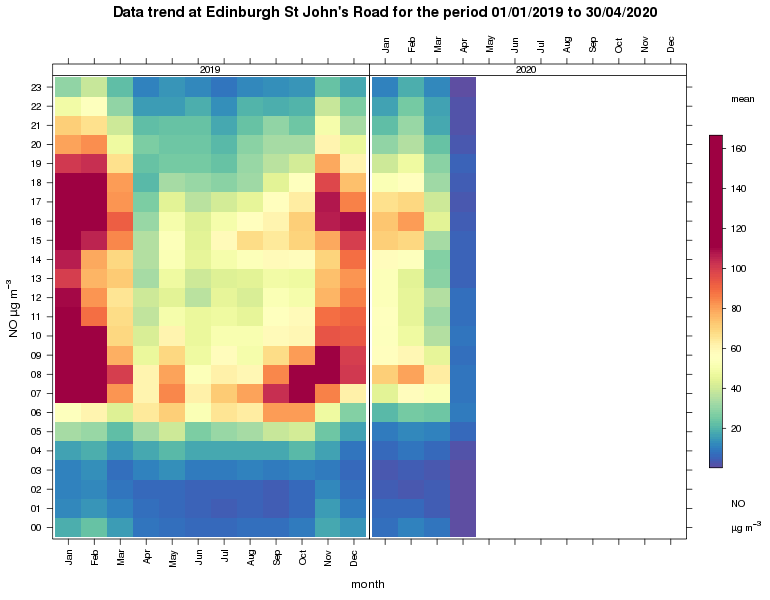
Nitrogen monoxide (NO). Monthly mean of hourly mean from January 2019 to April 2020. Red shows hours and months with high pollution levels. Blue shows low levels. Thus the bottom righthand corner deep blue square represents the monthly mean for NO as measured at midnight during April. The square above at 1:00 hours and so on. [NB. These recent measurements obtained from SAQN’s real-time analyser are provisional and do not yet have ‘ratified’ status. However, any retrospective correction to the archive dataset is only likely to result in minor rather than wholesale value changes.]
The second plot puts the first plot into a wider context. It displays the St John’s nitrogen monoxide data from 2007 onwards. This extended time-series shows many interesting features. These include the long-term declining trend (emissions control); the annual cycle (seasonal photochemistry); the daily cycle (daily photochemistry and rush hour emissions); meteorological variability and the lockdown.
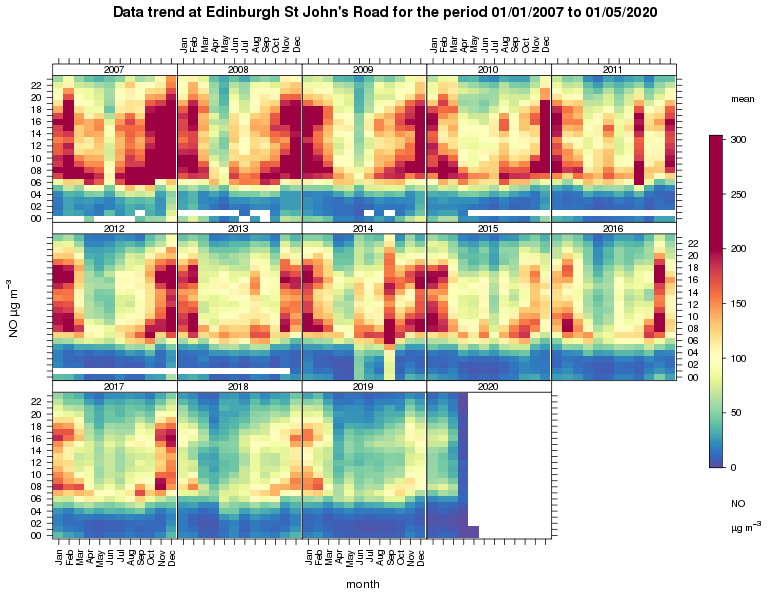
Nitrogen monoxide (NO). Monthly mean of hourly mean from January 2007 to April 2020. Red shows hours and months with high pollution levels. Blue shows low levels. [Beware the changed colour scale from plot 1.] NO typically shows a double peak through the day (one for each rush hour). This double peak is picked out well by the red squares (especially back in 2008-2015). Since then clean-air legislation has worked and NO levels can be seen to have been dropping. The first diagram (2019-2020) shows, however, that there is still room for much more improvement.
Deaths
Air pollution causes an estimated 400,000 premature mortalities in Europe every year. It is the single largest environmental health risk in Europe. In the UK, where once again air pollution is the biggest environmental threat to health, between 28,000 and 36,000 deaths a year are attributed to long-term exposure to pollution. The development of coronary heart disease, stroke, respiratory disease and lung cancer, and exacerbated asthma are all attributable to air pollution. Both chemical (e.g. NO and NO2) and particulate pollutants (e.g. particles smaller than 2.5 microns, PM 2.5) contribution strongly to the premature mortalities. In Scotland while NO and NO2 drop following lockdown, PM2.5 and PM10 show little change, presumably as much PM2.5 does not come from traffic.
By way of comparison I estimate COVID-19, in the UK, will eventually give rise to around 32,938 cumulative deaths (hospital reported). [A few days ago England started including deaths outside of hospital in its COVID-19 reporting for the first time. Whereas it is believed Scotland/Wales/N. Ireland had already been including those deaths.] Mortality analysis suggests that the UK hospital based estimate will need a major upward revision when all deaths in care homes and from COVID-19 knock-on effects are revealed and full accounted for. I currently anticipate a grand total of perhaps 45,000 to 50,000 excess UK mortalities (680 to 750 per million) when phase-1 draws to a close.
Postscript on congestion charging
Back in January I wrote to the Scotsman supporting Edinburgh Council’s decision to revisit the question of congestion charging using an improved road layout. Hopefully this type of analysis of the beneficial effects of COVID-19 on air quality can help bring the need for a congestion charge in big cities like Edinburgh into sharper focus.


Recent comments