
Glimmer of hope XVIII
COVID-19. Where are we now? What can we do? What does the future hold?
Part XVIII of Glimmer of hope (30-April-2020)
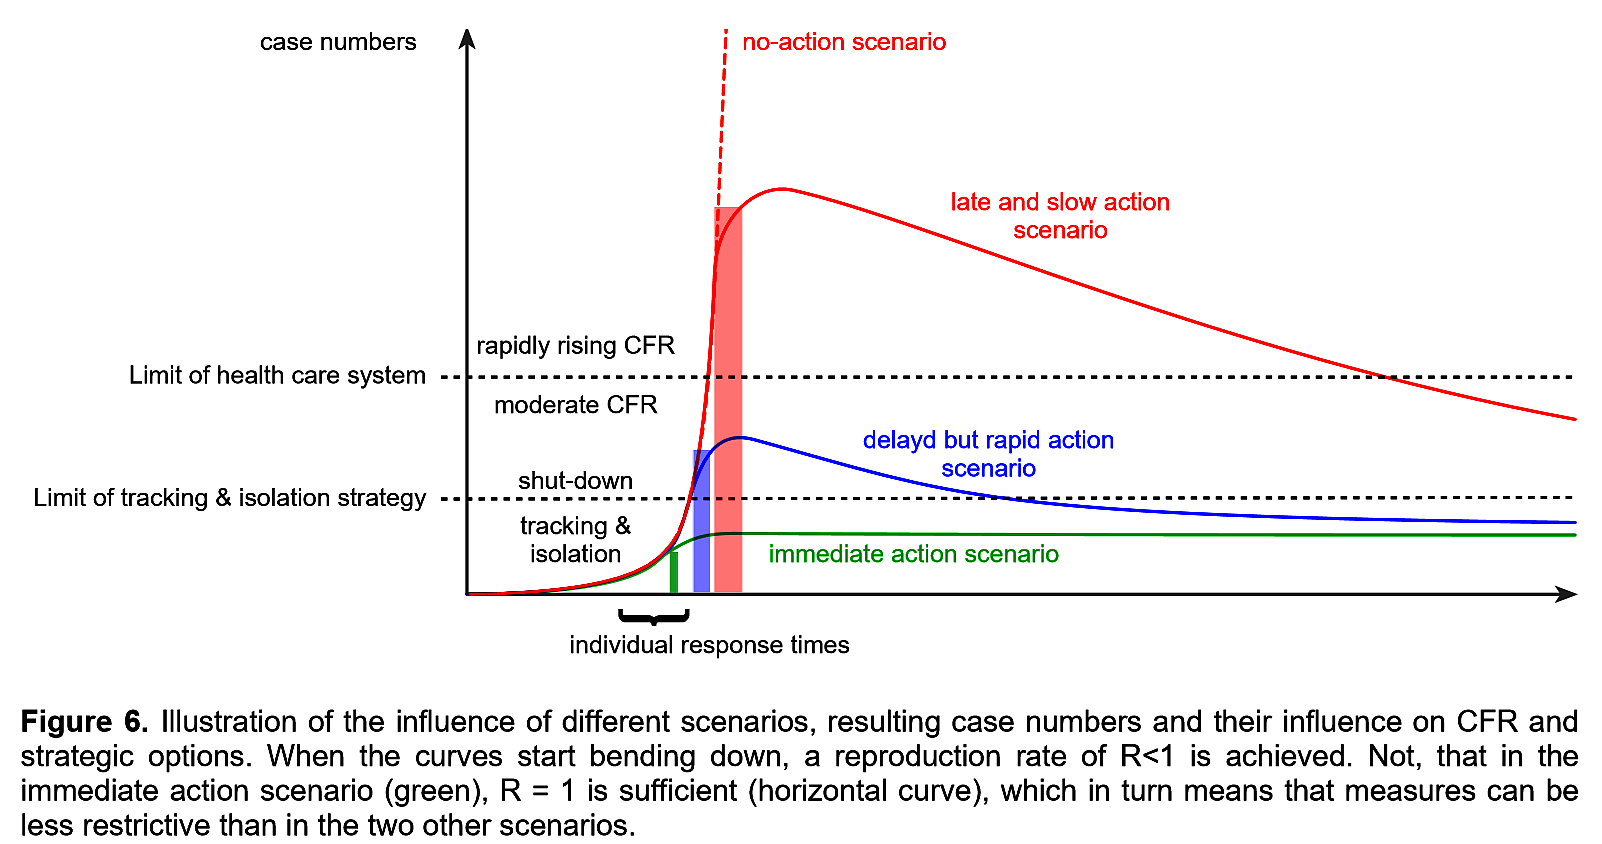
Graph and much of this blog page derives from Eppinger and Rueping
Summary
Despite early warnings, the COVID-19 pandemic took the world by surprise. An effective vaccine remains the world’s best hope. Individuals can and need to manage their risk. I list my top-7 strategic actions for life with COVID-19 when unlocking first gets underway.
Where are we now?
If you die of COVID-19 or suffer from lung damage for the rest of your life that is significant. Half of the world is under curfew, the pandemic has infected many more than 3,130,800 individuals and caused the deaths of well over 227,051 (data as of 30 April 2020). However, at this stage of the pandemic, that is insignificant. Given present rates of spread the virus will take 100 years for the global population of 8 billion to achieve safety through “herd immunity”. Only the development of an effective vaccine (2 years hence?) holds promise of a fast way out.
What can the individual do?
As the developed countries begin the slow process of lifting the phase-1 lock-down what precautions can individuals take in order to protect themselves, keep others safe and reduce overall risk? I will (and I suggest other people in my age group (the over 60s) should):
- Get used to wearing a mask as a social duty.
- Adopt the Thai, Japanese, South Korean style of meeting ceremony rather than continuing Anglo-Saxon handshaking or Mediterranean style kissing.
- Renew their hand-washing and frequent disinfecting of surfaces with increased vigour.
- Continue physical distancing measures.
- Continue online grocery shopping.
- Work from home as much as feasible.
- Avoid super-spreading events – sporting tournaments, parties, and visits to the theatre or cinema.
The future
A funding boost is needed into pandemic-related research – e.g. into vaccine development, better estimation-prediction techniques, the effectiveness of preventative measures, behavioural responses and in technology driven tracing and isolation strategies. In particular, from my point of view as a number cruncher, we need more testing and more reliable data. NB. Just 1% of the projected global economic losses from the COVID-19 crisis could support 45,000 research scientists for 20 years.
Increased monitoring is by far the best way for early detection of any resurgence by the virus into a 2nd peak and the production of further economic mayhem. Extensive testing can provide countries with the time to react promptly. Theoretical modelling (Britton, 15 April 2020), ever improving datasets and common sense all support the view that at the start of an epidemic every day is crucial. The vast differences in infection and death rates between countries have been found to relate to the actions, or inactions, of their governments especially over travel control measures. Early and swift reactions, as opposed to woefully slow actions, helped contain the epidemic.
Worst of all was the deliberate “herd immunity” enhancing policy of the UK Government. Their inactivity accelerated the local epidemic and led to many unnecessary deaths, especially in care homes.
This blog page borrows heavily from the excellent, open access, review paper recently made available online by Eppinger and Rueping (posted 28 April 2020).


So who was to blame for UKs inaction? Did the Government follow the wrong science or were they driven by political imperatives?
John, I like the euromomo graphics. I have updated my total mortality estimate for the UK on my next blog page. The Office for National Statistics should give us their weekly update on UK mortality on Tuesday (tomorrow). Although it will relate to deaths from (on average) one and a half weeks previously it is the best we have for understanding the scale of the ‘true’ COVID-19 related mortalities across the whole community. And hence the best data for figuring out the multiplier that needs to be appled to hospital only deaths. It is certainly not looking good for the UK. The Uk could, by the end of phase-1, easily end up as being the worst in Europe.
John, This fragment from the Guardian, 24 April 2020 says it all.
The government’s former chief scientific adviser Sir David King said he was “shocked” to discover there were political advisers on Sage. “If you are giving science advice, your advice should be free of any political bias,” he said. “That is just so critically important.” Told that Cummings was in the 23 March meeting, King replied: “Oh my goodness. Isn’t this maybe why they don’t want us to know who was there?” King said political advisers were never on the equivalent committees of Sage when he chaired them and argued that Cummings, who is not a scientist, could report his own interpretation of Sage advice back to the prime minister.
https://www.theguardian.com/world/2020/apr/24/revealed-dominic-cummings-on-secret-scientific-advisory-group-for-covid-19
Roy Thanks for the link. Glad to see David King is putting together an alternative SAGE committee of experts. Elsewhere, interesting debates going on about the ‘best metric’ for the covid-19 impact. ‘All cause mortality’ seems to get round the problem of different definitions and reporting methods. See Euromomo site https://www.euromomo.eu/graphs-and-maps/#excess-mortality which shows z scores plots for all countries – where UK (England) looks like the worst in Europe. In contrast, Germany’s excess deaths fall within normal annual range. Would you agree Roy?
A naïve q but what causes the asymmetry (slower decline than ascent) of cases and deaths for the UK, in comparison with the symmetry you show in “Part II (7-April-2020) China / World / Spanish flu” for China’s death rate through:
“a full cycle of the first wave of the COVID-19 pandemic. Notice the very symmetrical response.”
Is China symmetrical because of their stringent handling of cases (especially isolating positive cases rather than relying on self-isolation)?
If Yes, then is the degree of symmetry versus asymmetry correlated with the speed versus slowness with which different governments began to handle the problem? Of the aggressiveness versus patheticness of safety behaviors adopted by their citizens?
Or British apples versus Mandarin oranges?
Anyway, thanks for your blog!
Dear northern Mistress of the Labyrinth (Ariadne),
Not a naïve question at all. I presume the main cause of the asymmetry is attributable to your first suggestion – the difference in stringency of the counter measured imposed. Symmetric or slightly right-skewed epidemics trajectories dominate in China, both in the badly hit Hubei province (population 59 million) and the largely spared other mainland provinces (with a combined population of 1,326 million). Countries in the West are seeing much stronger skewing and extended (economically damaging) tails. Briefly there are two ways of containing an epidemic – “herd immunity” (with huge loss of life ) vs “low R”.
China reversed the epidemic growth by lowering the transmission rate (R) through strict lockdowns. The West (eg USA) appears to be determined not to learn from China’s success. A spatial analysis of the spread of COVID-19 in Italy illustrates why some areas are hit harder than others. The conclusion of the authors (Sebastien Bourdin et al., 2020) was “Our findings … indicate that the implementation of a lockdown [in parts of Italy] at the beginning of March was a crucial and effective approach to slowing the spread of the virus further”. it would seem that once the virus takes hold in developed, western societies it becomes more and more difficult to get R down (to below one) and keep it there. Bourdin et al. reference