
Glimmer of hope XVII
Scotland vs. the United Kingdom
Part XVII of Glimmer of hope (28-April-2020)
Summary
In terms of the course of COVID-19 infections Scotland leads the United Kingdom by two to three days. New COVID-19 infections rose slightly more rapidly to peak in Scotland than in the United Kingdom. Cases of new infections are now declining. Scottish infections are declining at a parallel rate to the UK most likely with a two to three day lead. Per capita numbers in the two regions have been very similar.
Scotland
The trajectory of Scottish infections,caused by COVID-19 is found to follow the UK trend. Comparisons between regions with modest sized populations are, of course, problematic because the available data are scarce and very scattered. Consequently governments find it extremely difficult to decide on the leads and lags between the different regions of the United Kingdom. Nevertheless the statistical method I am using, which originated with King-Hubbert’s work on forecasting oil production and was extended by Clark andThompson to model springtime flowering (eg of Crocosmia), is very amenable to analysing the leads or lags between regional curves. The graph below compares the trajectories.
One assumption about the data used in the analysis is that the monitoring methods employed in the different regions are not grossly dissimilar. Here both focus on monitoring subjects in hospitals, rather than in the community at large. [Interestingly the UK Government announced this very afternoon that it intends to start including testing in care homes in new infection reports.] An additional modelling assumption is that the trajectories have the same general shape but are offset in time from one another.
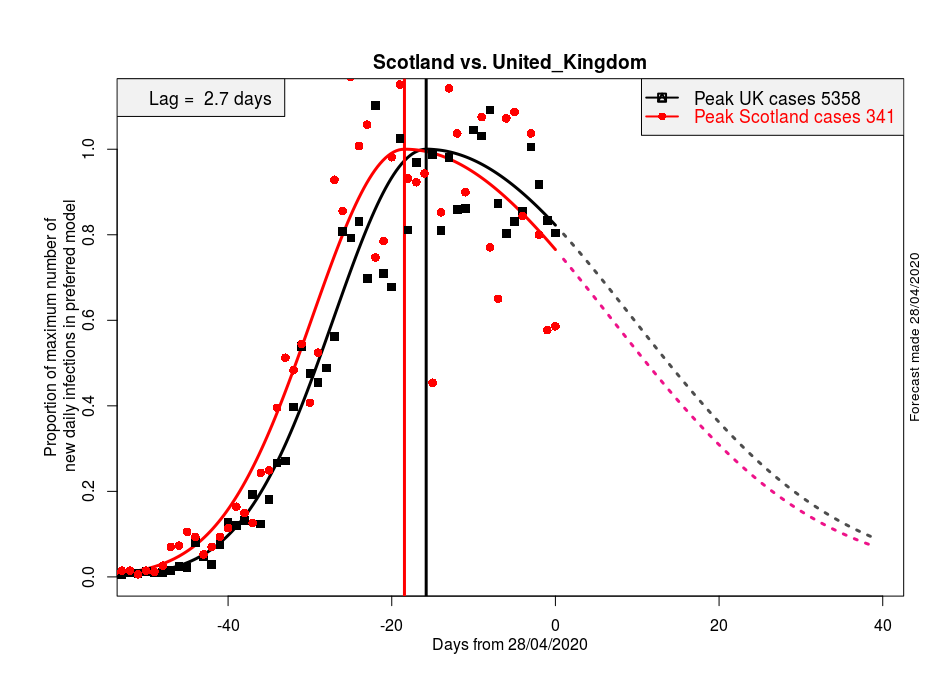
Trajectories of new infections. Red – Scotland. Black – United Kingdom (Includes England, Wales, Northern Ireland and Scotland). All data presented as proportion of peaks. Solid curves (at left) empirical fits. Dashed curves (at right) projections. Vertical lines – date of peaks (as modelled).
Scotland on a per capita basis has seen slightly fewer cases than the UK. Scotland’s positive test rate index (cases/tests) is also slightly lower.
| Region | Date of peak
(model) |
Peak cases
(model daily) |
Total tests
(by 28th April) |
Total population
(million in 2019) |
| Scotland | 10th April | 341 | 51499 | 5.45 |
| UK | 12th April | 5358 | 719910 | 67.53 |
I conclude that there is very little difference between the two regions. Scotland’s epidemic perhaps leading in time by two to three days. The infection rates have been similar. Decline rates are similar. Scotland possibly slightly leading during the decline phase. At present, based on the prevalence of new cases, there is no reason to begin the unlocking process in Scotland at a very different date to that of the UK as a whole.
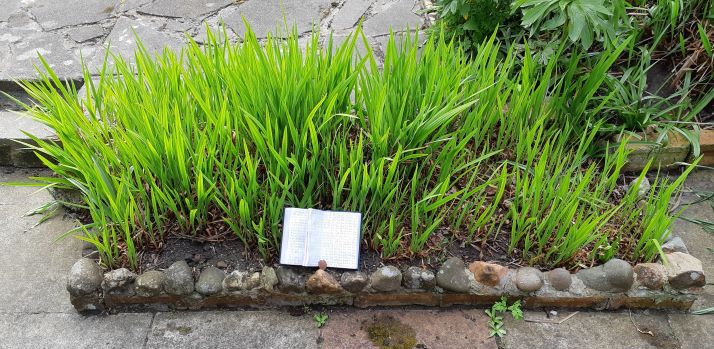
Patch of Crocosmia (and field note book) used in the Clark and Thompson (2011) Estimation and comparison of flowering curves study. (Photographed today, 28th April 2020, by CLT).
Data sources: ECDC (ecdc.europa.eu), Scotland Coronavirus Tracker (@TravellingTabby), Office for National Statistics (ons.gov.uk)


Recent comments