Any views expressed within media held on this service are those of the contributors, should not be taken as approved or endorsed by the University, and do not necessarily reflect the views of the University in respect of any particular issue.
Digimap is an online map and data delivery service, available by subscription to UK Higher and Further Education establishments. Operated by EDINA at the University of Edinburgh, Digimap offers a number of data collections, including Ordnance Survey, historical, geological, aerial photography, LiDAR, marine maps, land cover mapping, global mapping and census data. For more information about Digimap go to our website: https://digimap.edina.ac.uk Background image Contains OS data (c) Crown Copyright and database right 2022
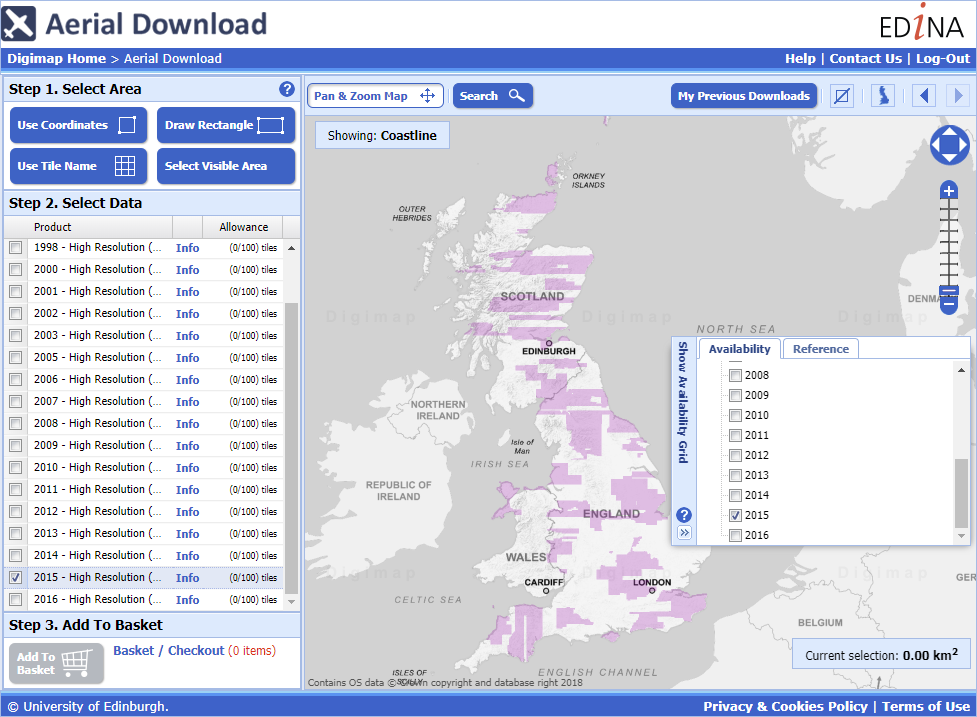
You can now search and download the imagery data from Aerial Digimap by the year it was flown.
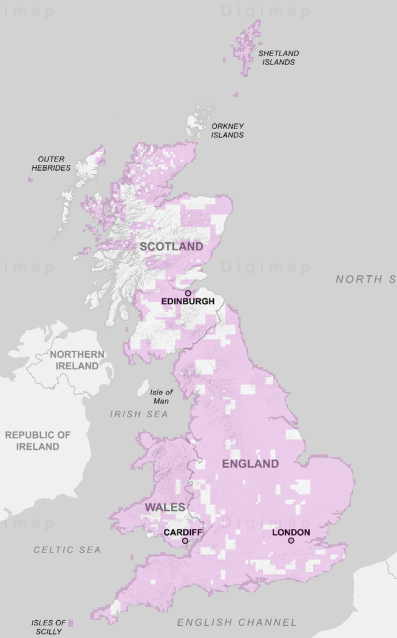
This allows you to be sure that you are downloading only the latest data, but it also allows you to download multiple images for the same location taken on different dates. We currently have data from 1998 through to 2016, with more English and Welsh images coming for 2016. When you are in Aerial Download you can see the extents of each year using the Show Availability Grid tool on the right side of the map as shown in the image above.
There is a table below detailing how many 1x1km images there are for each year, with the majority coming from 2013 to 2016, but some of the older images will be very useful to compare to the newer ones where they overlap:
Year
Number of Images
1998
165
2000
855
2001
891
2002
75
2003
11
2005
423
2006
4,620
2007
7,799
2008
5,757
2009
25,066
2010
35,607
2011
18,642
2012
16,619
2013
54,534
2014
71,404
2015
81,378
2016
18,769
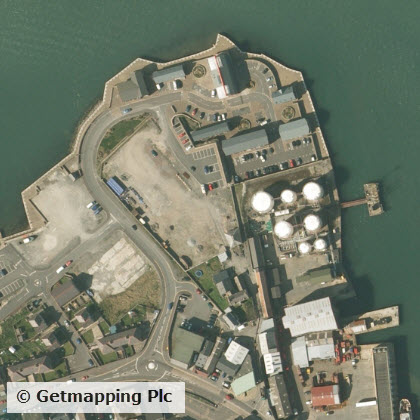
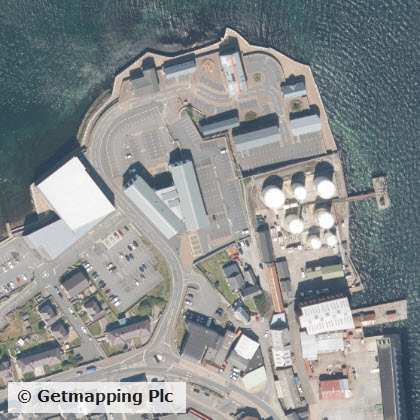
Here are two images of Lerwick taken 8 years apart:
Lerwick 2008 from Aerial Digimap.Lerwick 2016 from Aerial Digimap.
As you can see there has been construction in the West of the area with new buildings and car parks added.
We hope that you find the ability to make this sort of comparison useful for your research. If you have any questions about this or any other aspects of the Digimap service then please don’t hesitate to contact us.
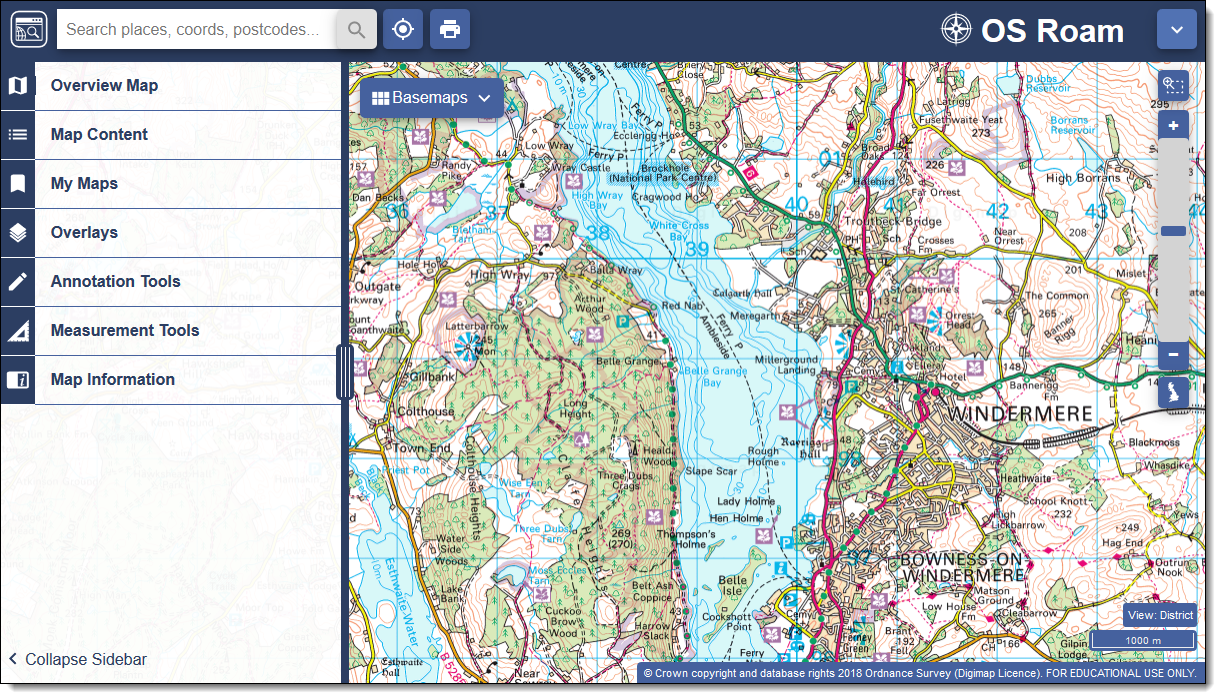
EDINA is very pleased to announce that Digimap Roam will be updated on Thursday 17th May 2018 to the new version currently available as beta. This change will apply to all Digimap Collections. The beta version has been available since November 2017 and as a result of feedback we have continued to improve it, adding some useful new features:
A “locate me” button – puts a pin on the map according to your current location
A “coordinate capture” tool – under Map Information, allows you to click a point and copy/paste the coordinates into other applications
A Variable width side panel to offer a larger map window
We are very excited about the new Roam, which has a fresher feel and a more modern look; it’s tablet-friendly with tools that are easier to find and use. All the main functions are located in the top left hand area, with a pull-out side panel ensuring maximum visibility of the map.
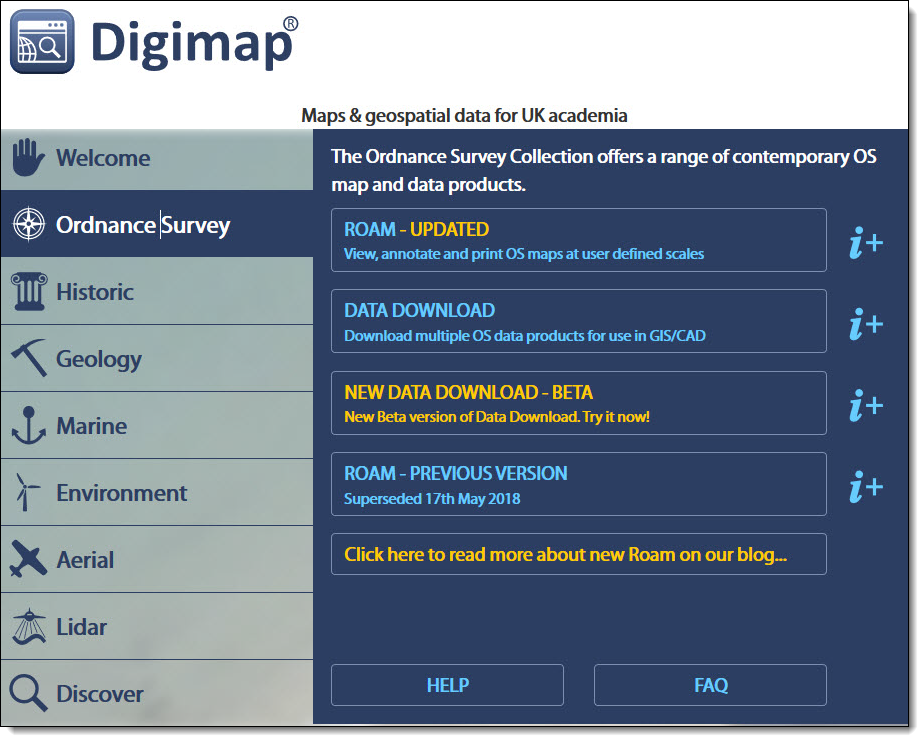
The new version of Roam will appear at the top of the list of applications in each Collection and will be labelled “Updated”. The previous version for each Collection will still be available until 31st July 2018:
We will be running a webinar about the new version of Roam on Wednesday 23 May from 1- 2pm. You can register for this here http://edina.ac.uk/training-and-events. Places are limited, but the webinar will be recorded and available to view later on our YouTube channel. Help pages for the new version of Roam will also be available.
As ever, we welcome feedback on Digimap. Please don’t hesitate to get in touch using any of our social media channels or use our email address or telephone number:
Ordnance Survey have released nearly 5000 extra 5km squares of building height data, with the total coverage increasing from 2578 to 7302. Each square has at least one building with height attributes added, with most fully covered. We have added this data to Digimap’s Data Download facility allowing you easy access to the data you need.
The Building Heights data is available from Data Download in a range of formats created especially for Digimap users. The most straightforward to use are DWG, File Geodatabase and KML which can be viewed directly in CAD, GIS and Google Earth respectively. You can also take the data as a CSV list that can be joined to the attribute table of any existing MasterMap Building data you have, using the TOID identifier. This means that you don’t have to recreate your project work with new data if you have already spent a lot of time working on it; as long as the buildings still have a TOID in their attribute data you can add the height information to it.
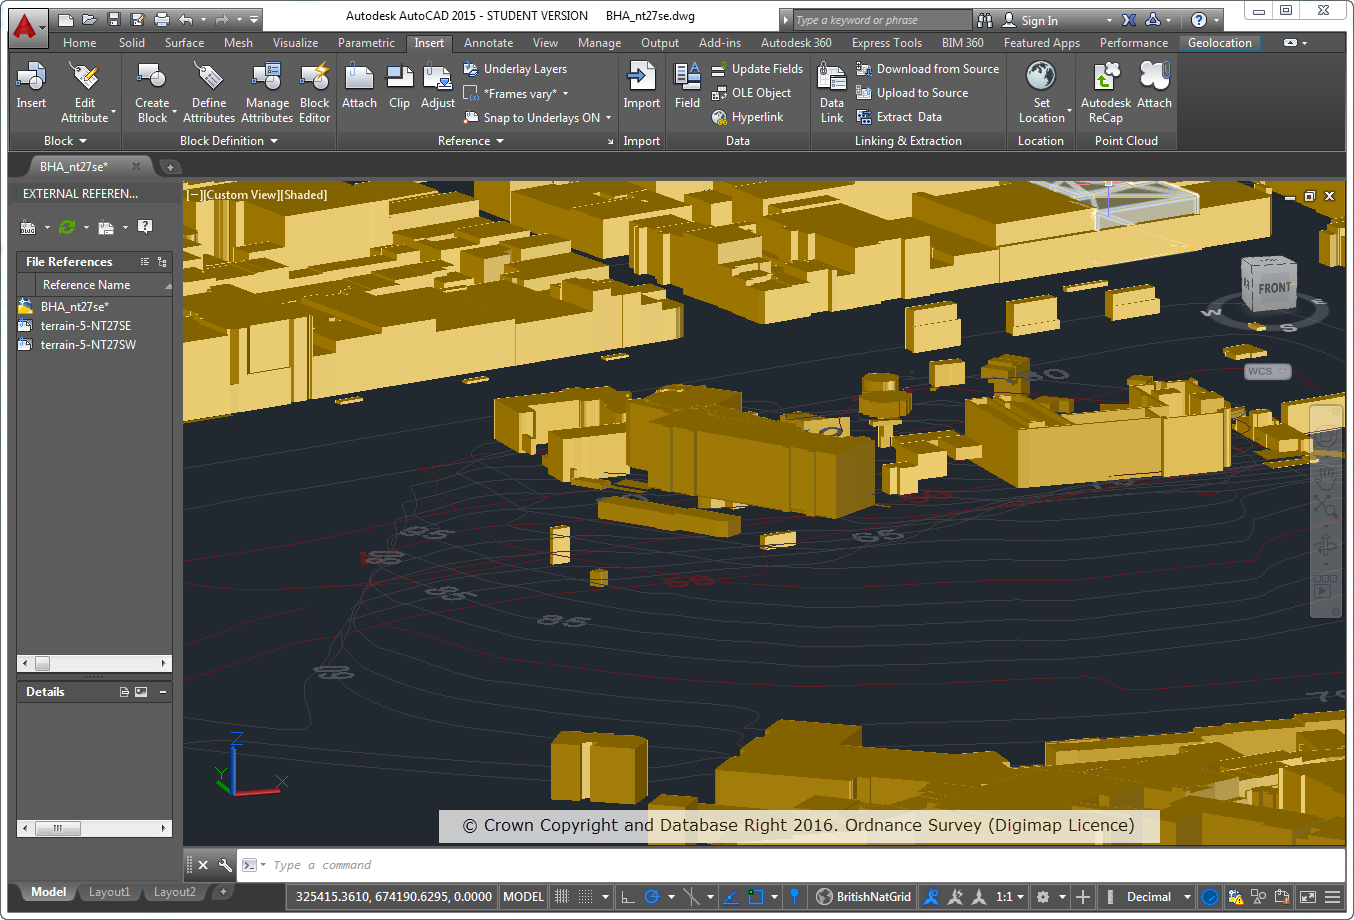
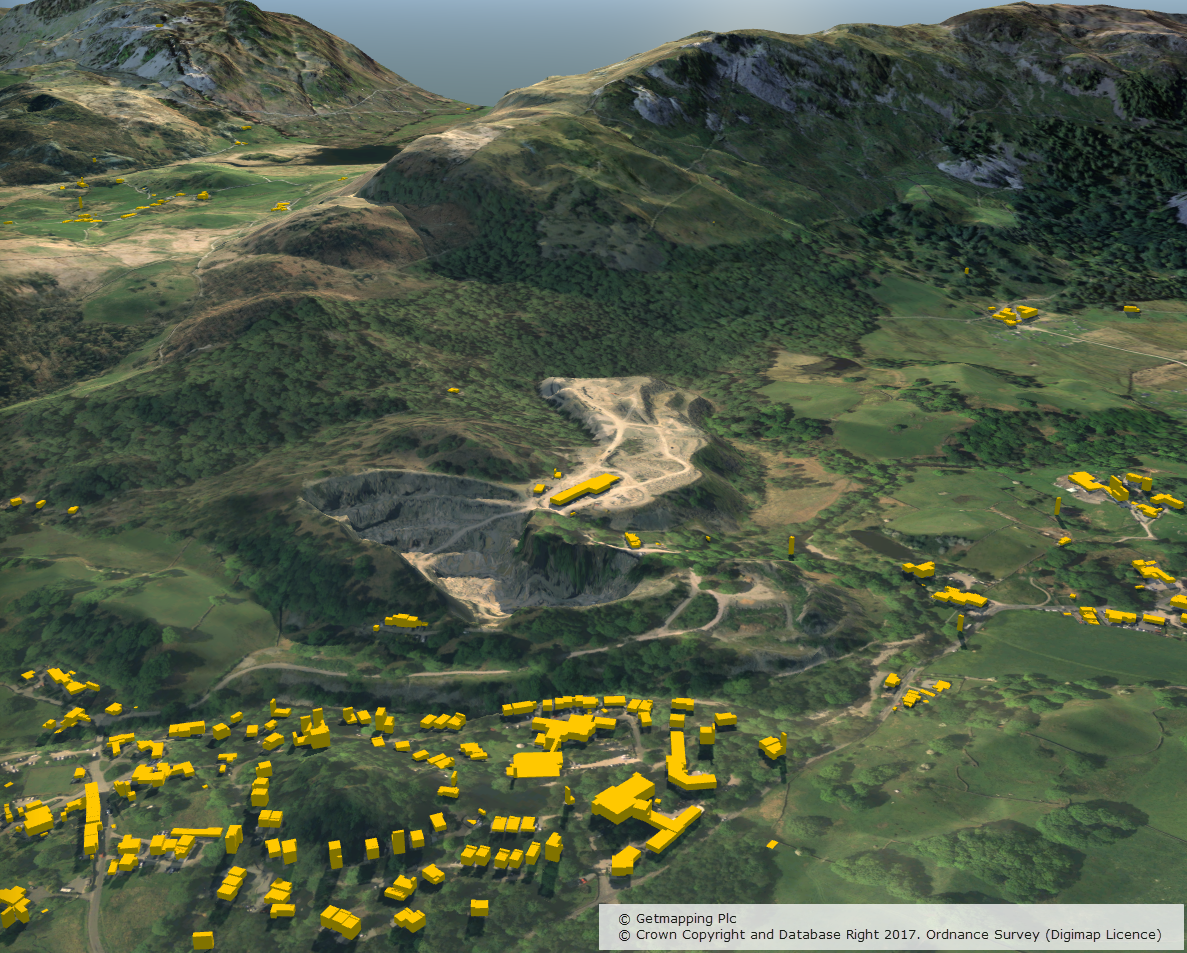
The Building Heights data is ideal for anyone working with the MasterMap data in 3D and has a range of applications in Architecture, Landscape Architecture, Environmental Modelling, Archaeological Reconstructions and many more different disciplines. Here are a couple of examples:
OS MasterMap Topography Layer Building Height Attribute data on top of OS Terrain 5 Contours
3D model using Aerial Imagery, OS Terrain 5 DTM and MasterMap Building Heights Data
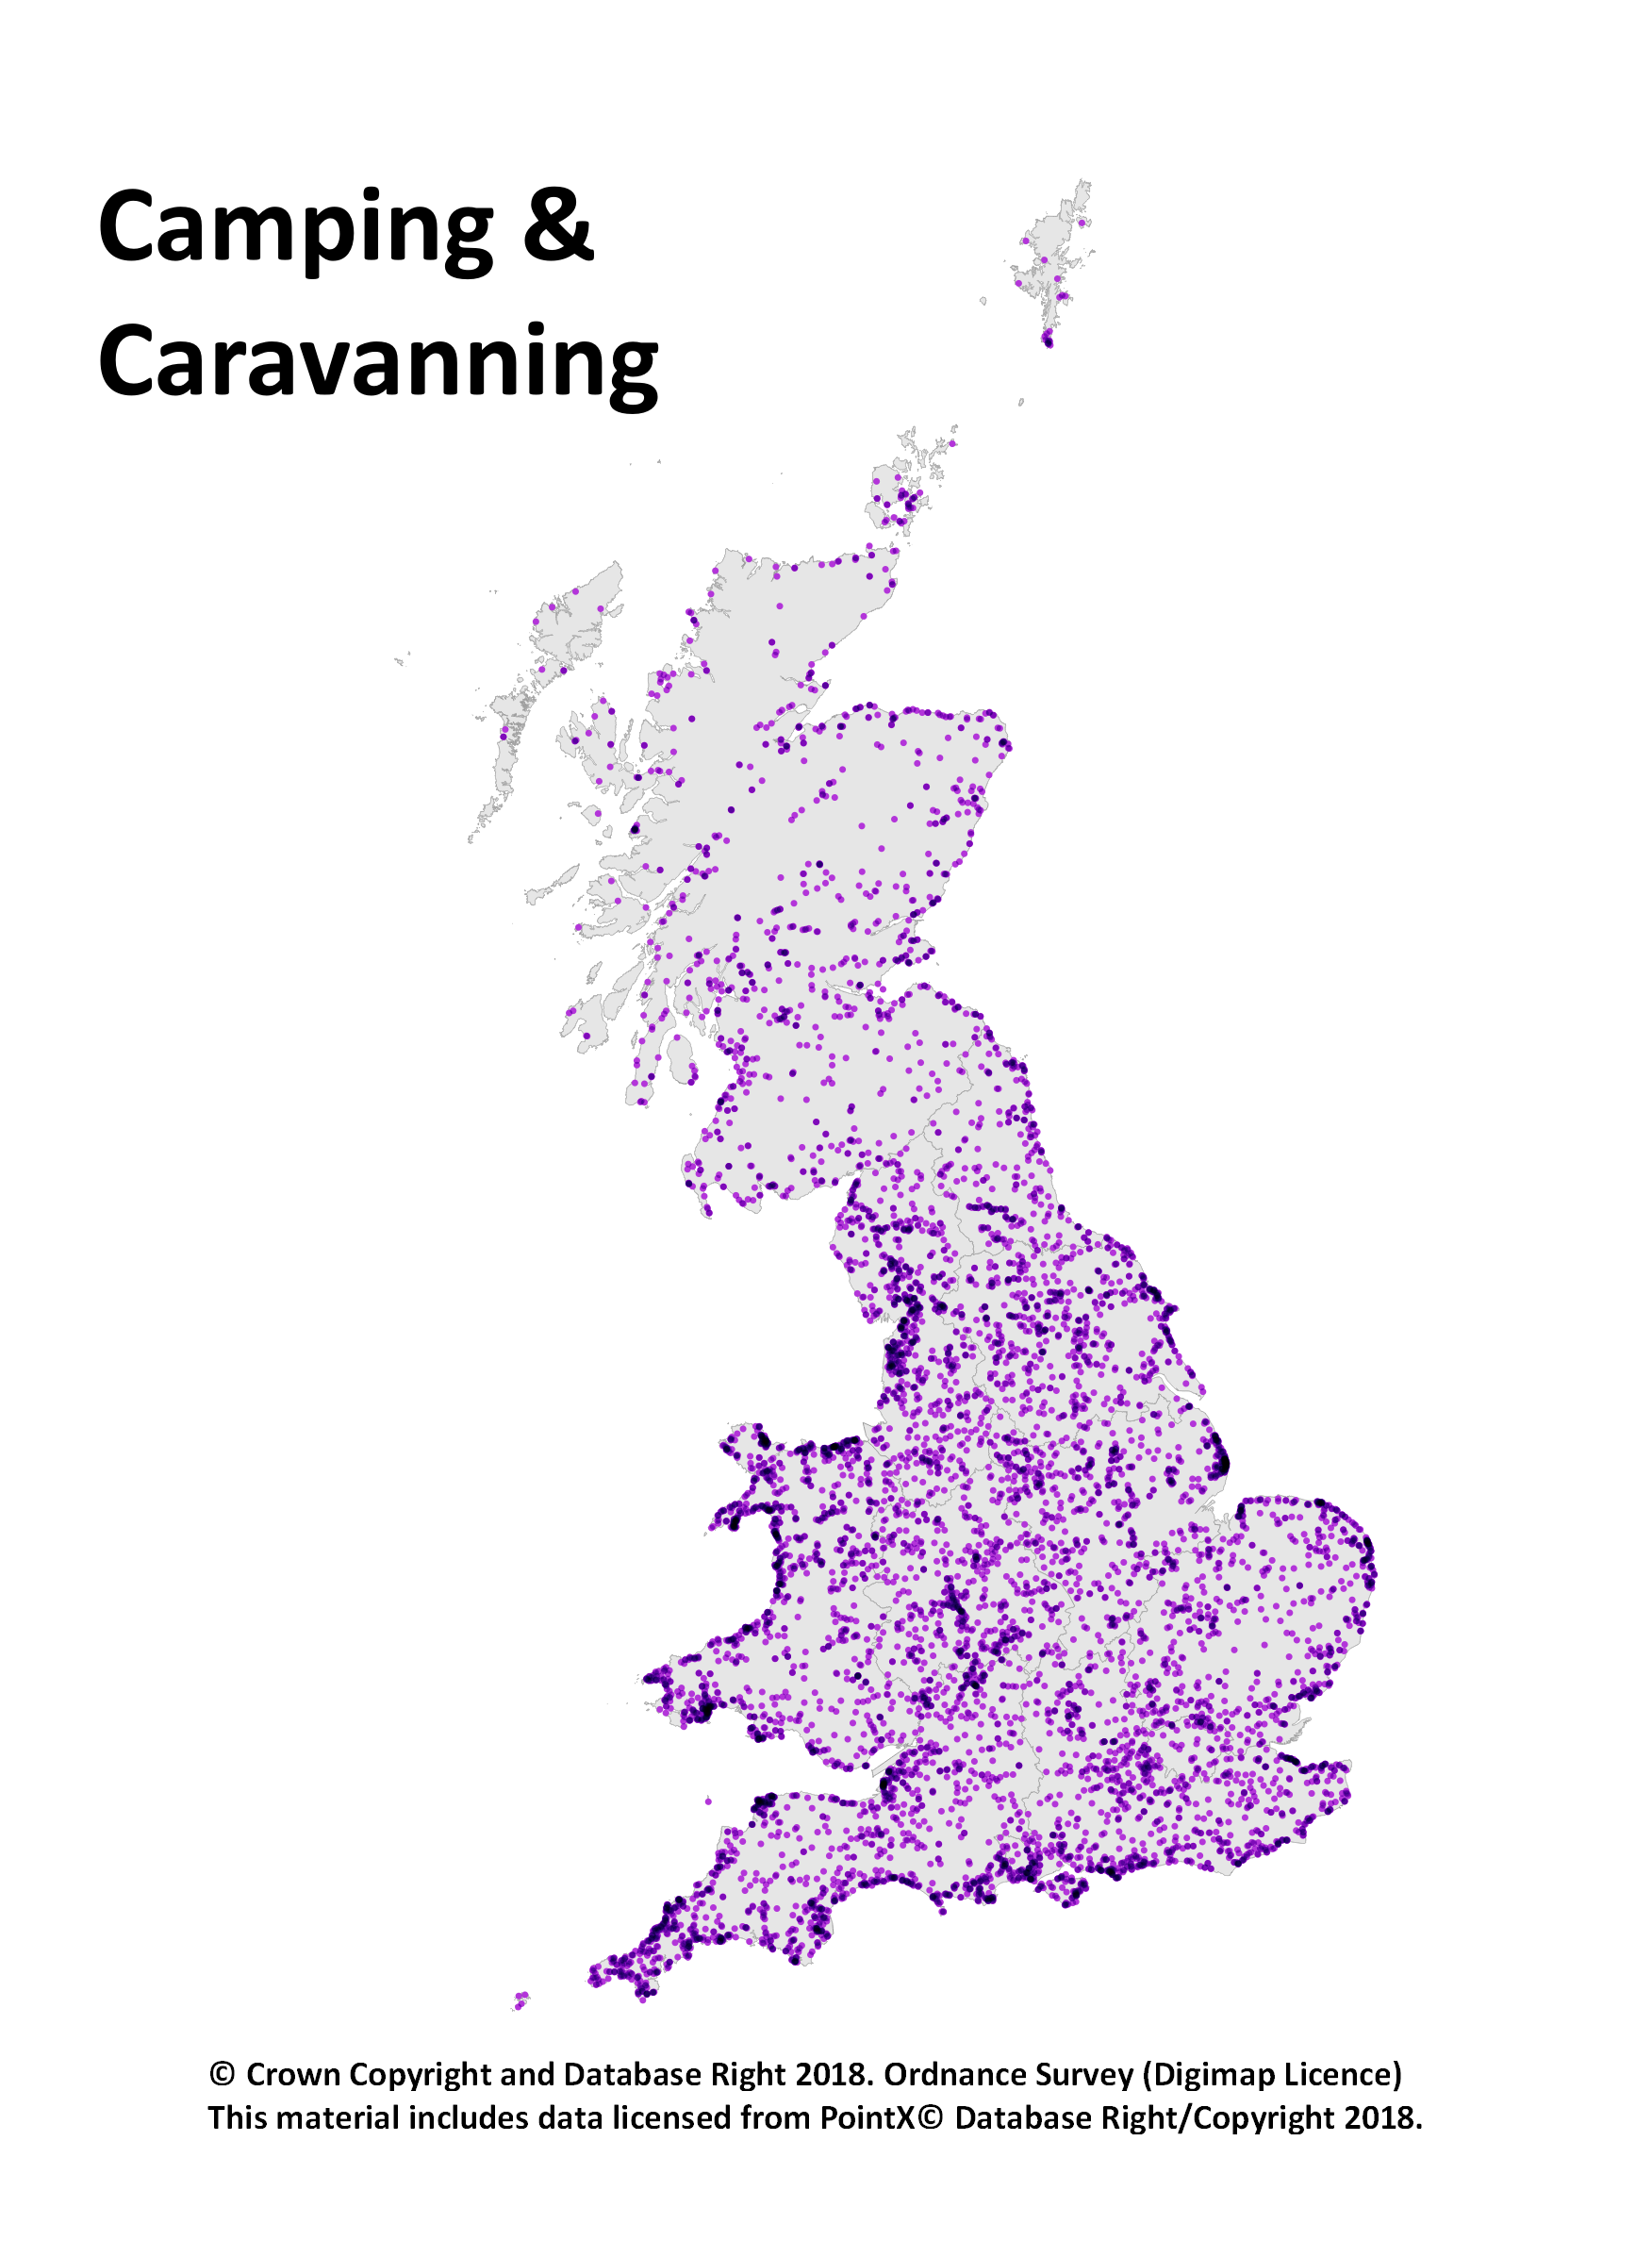
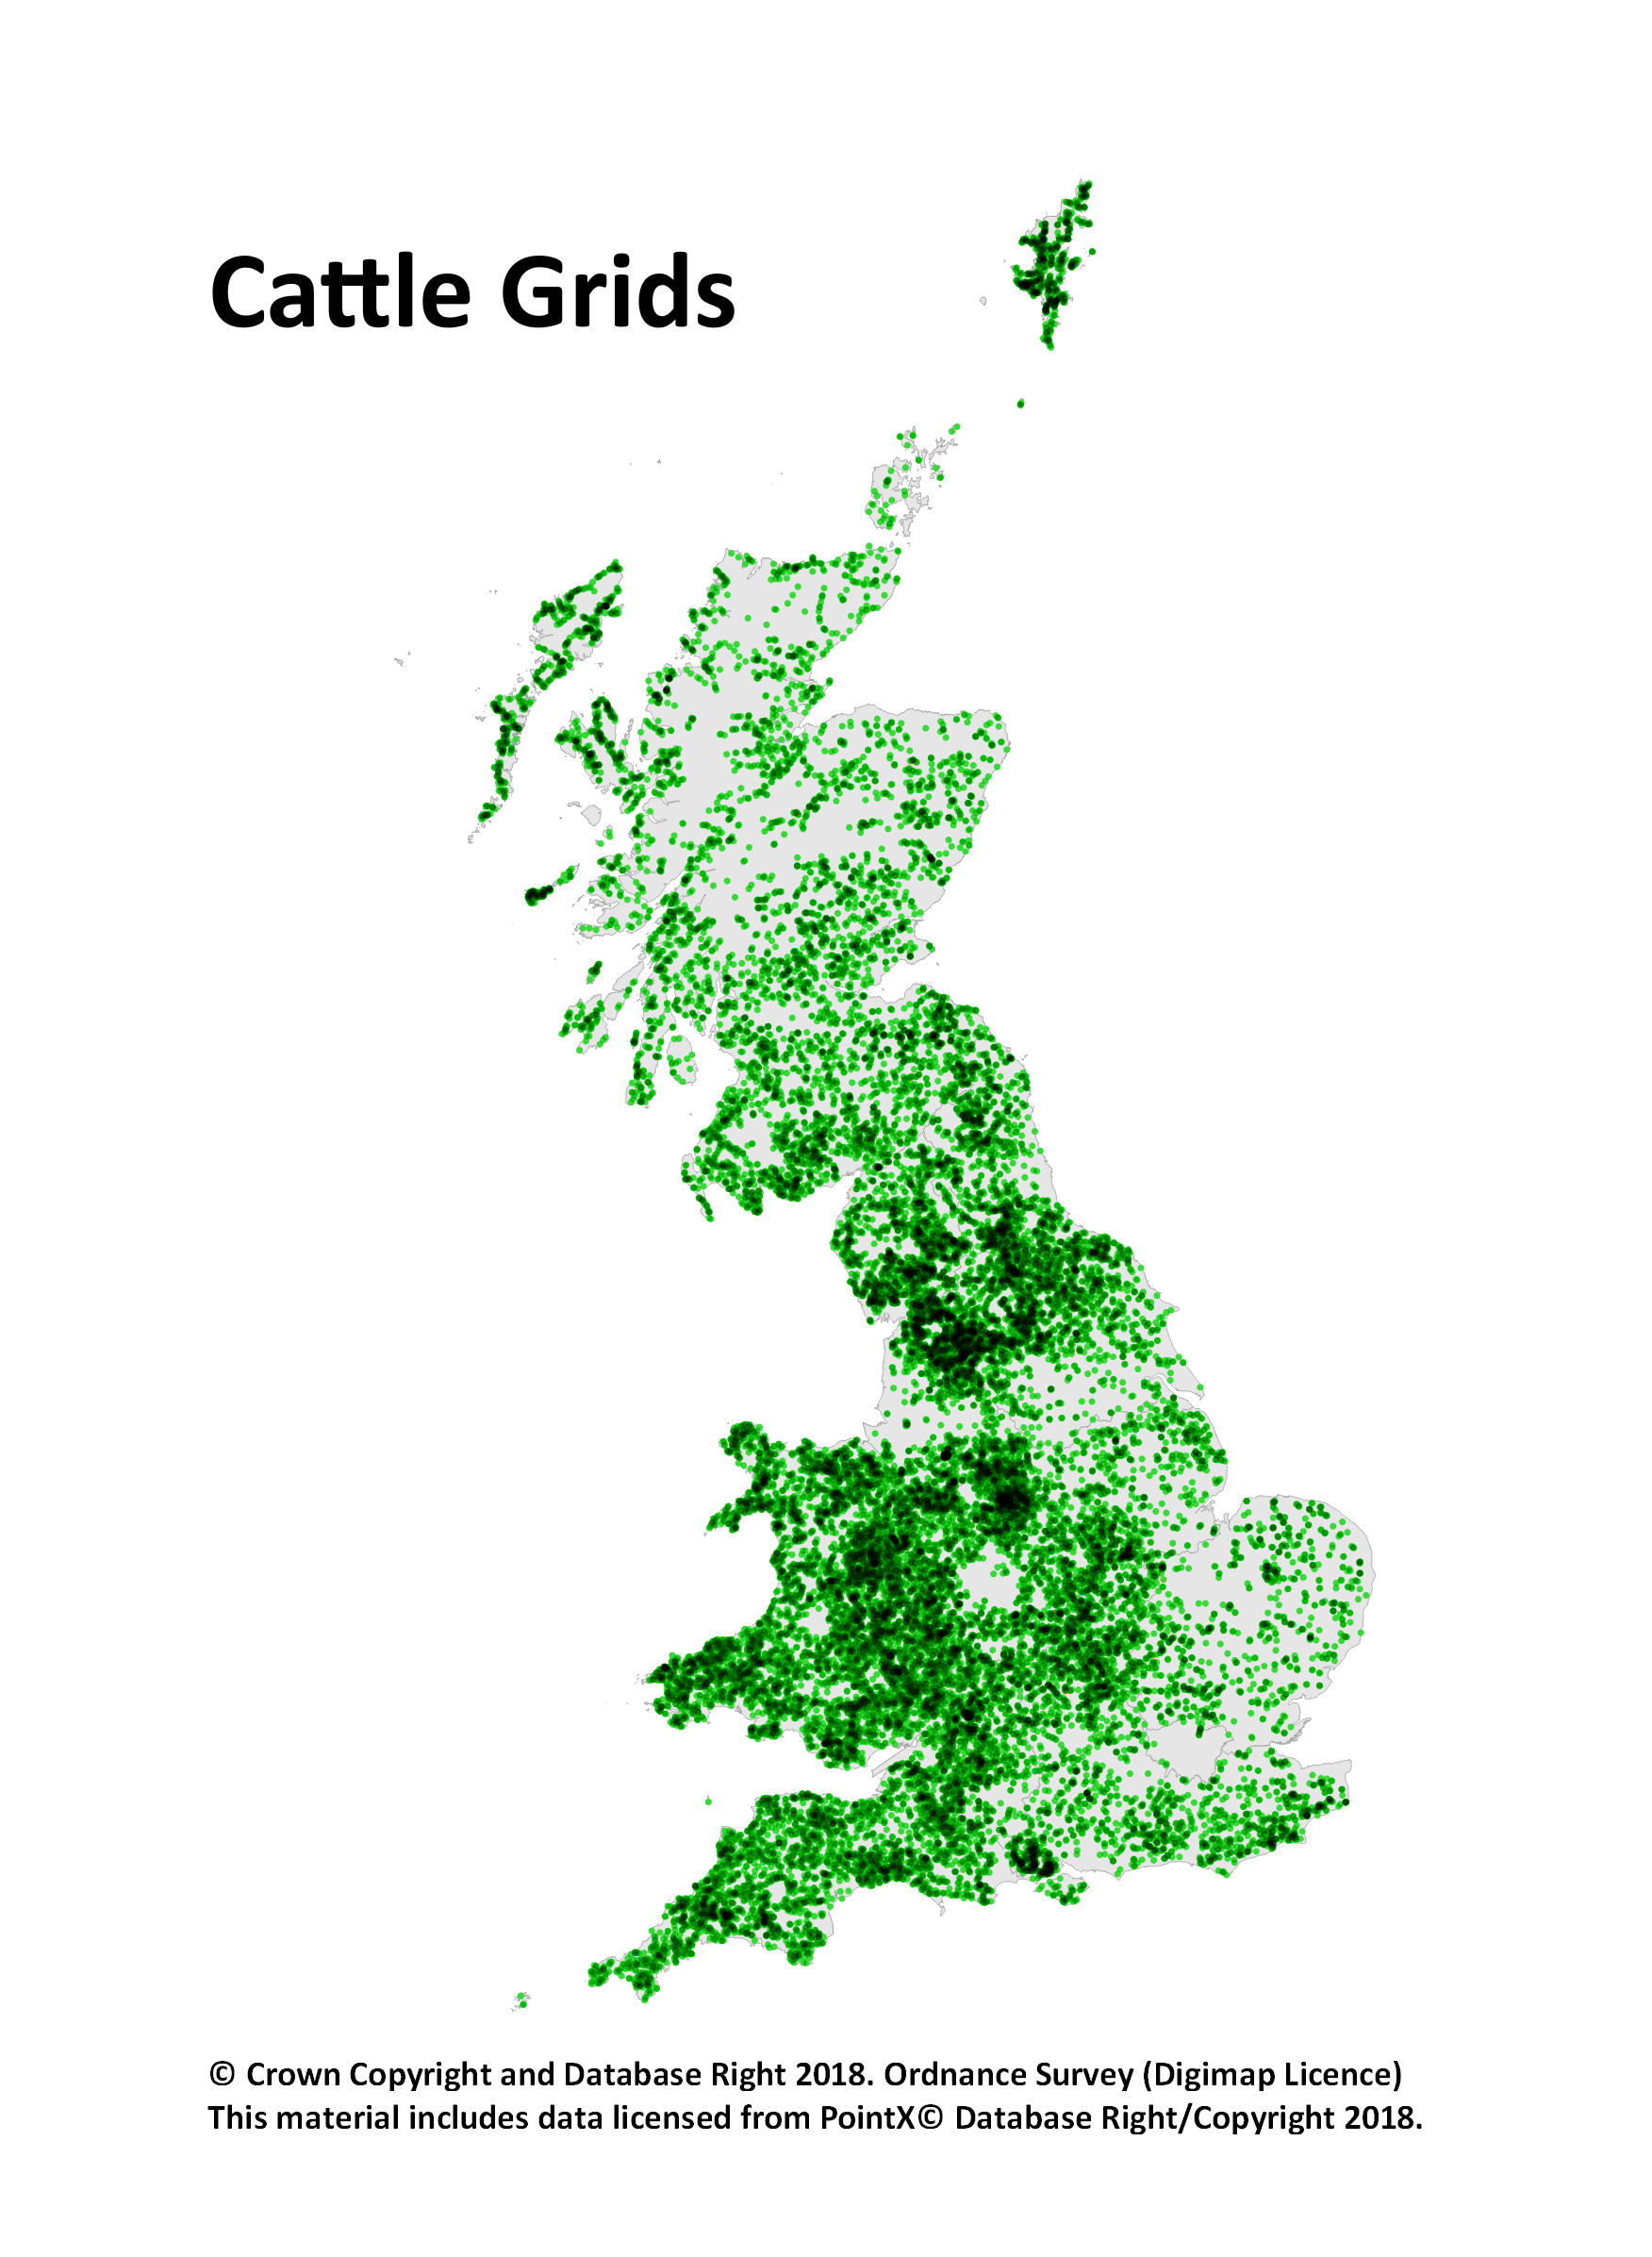
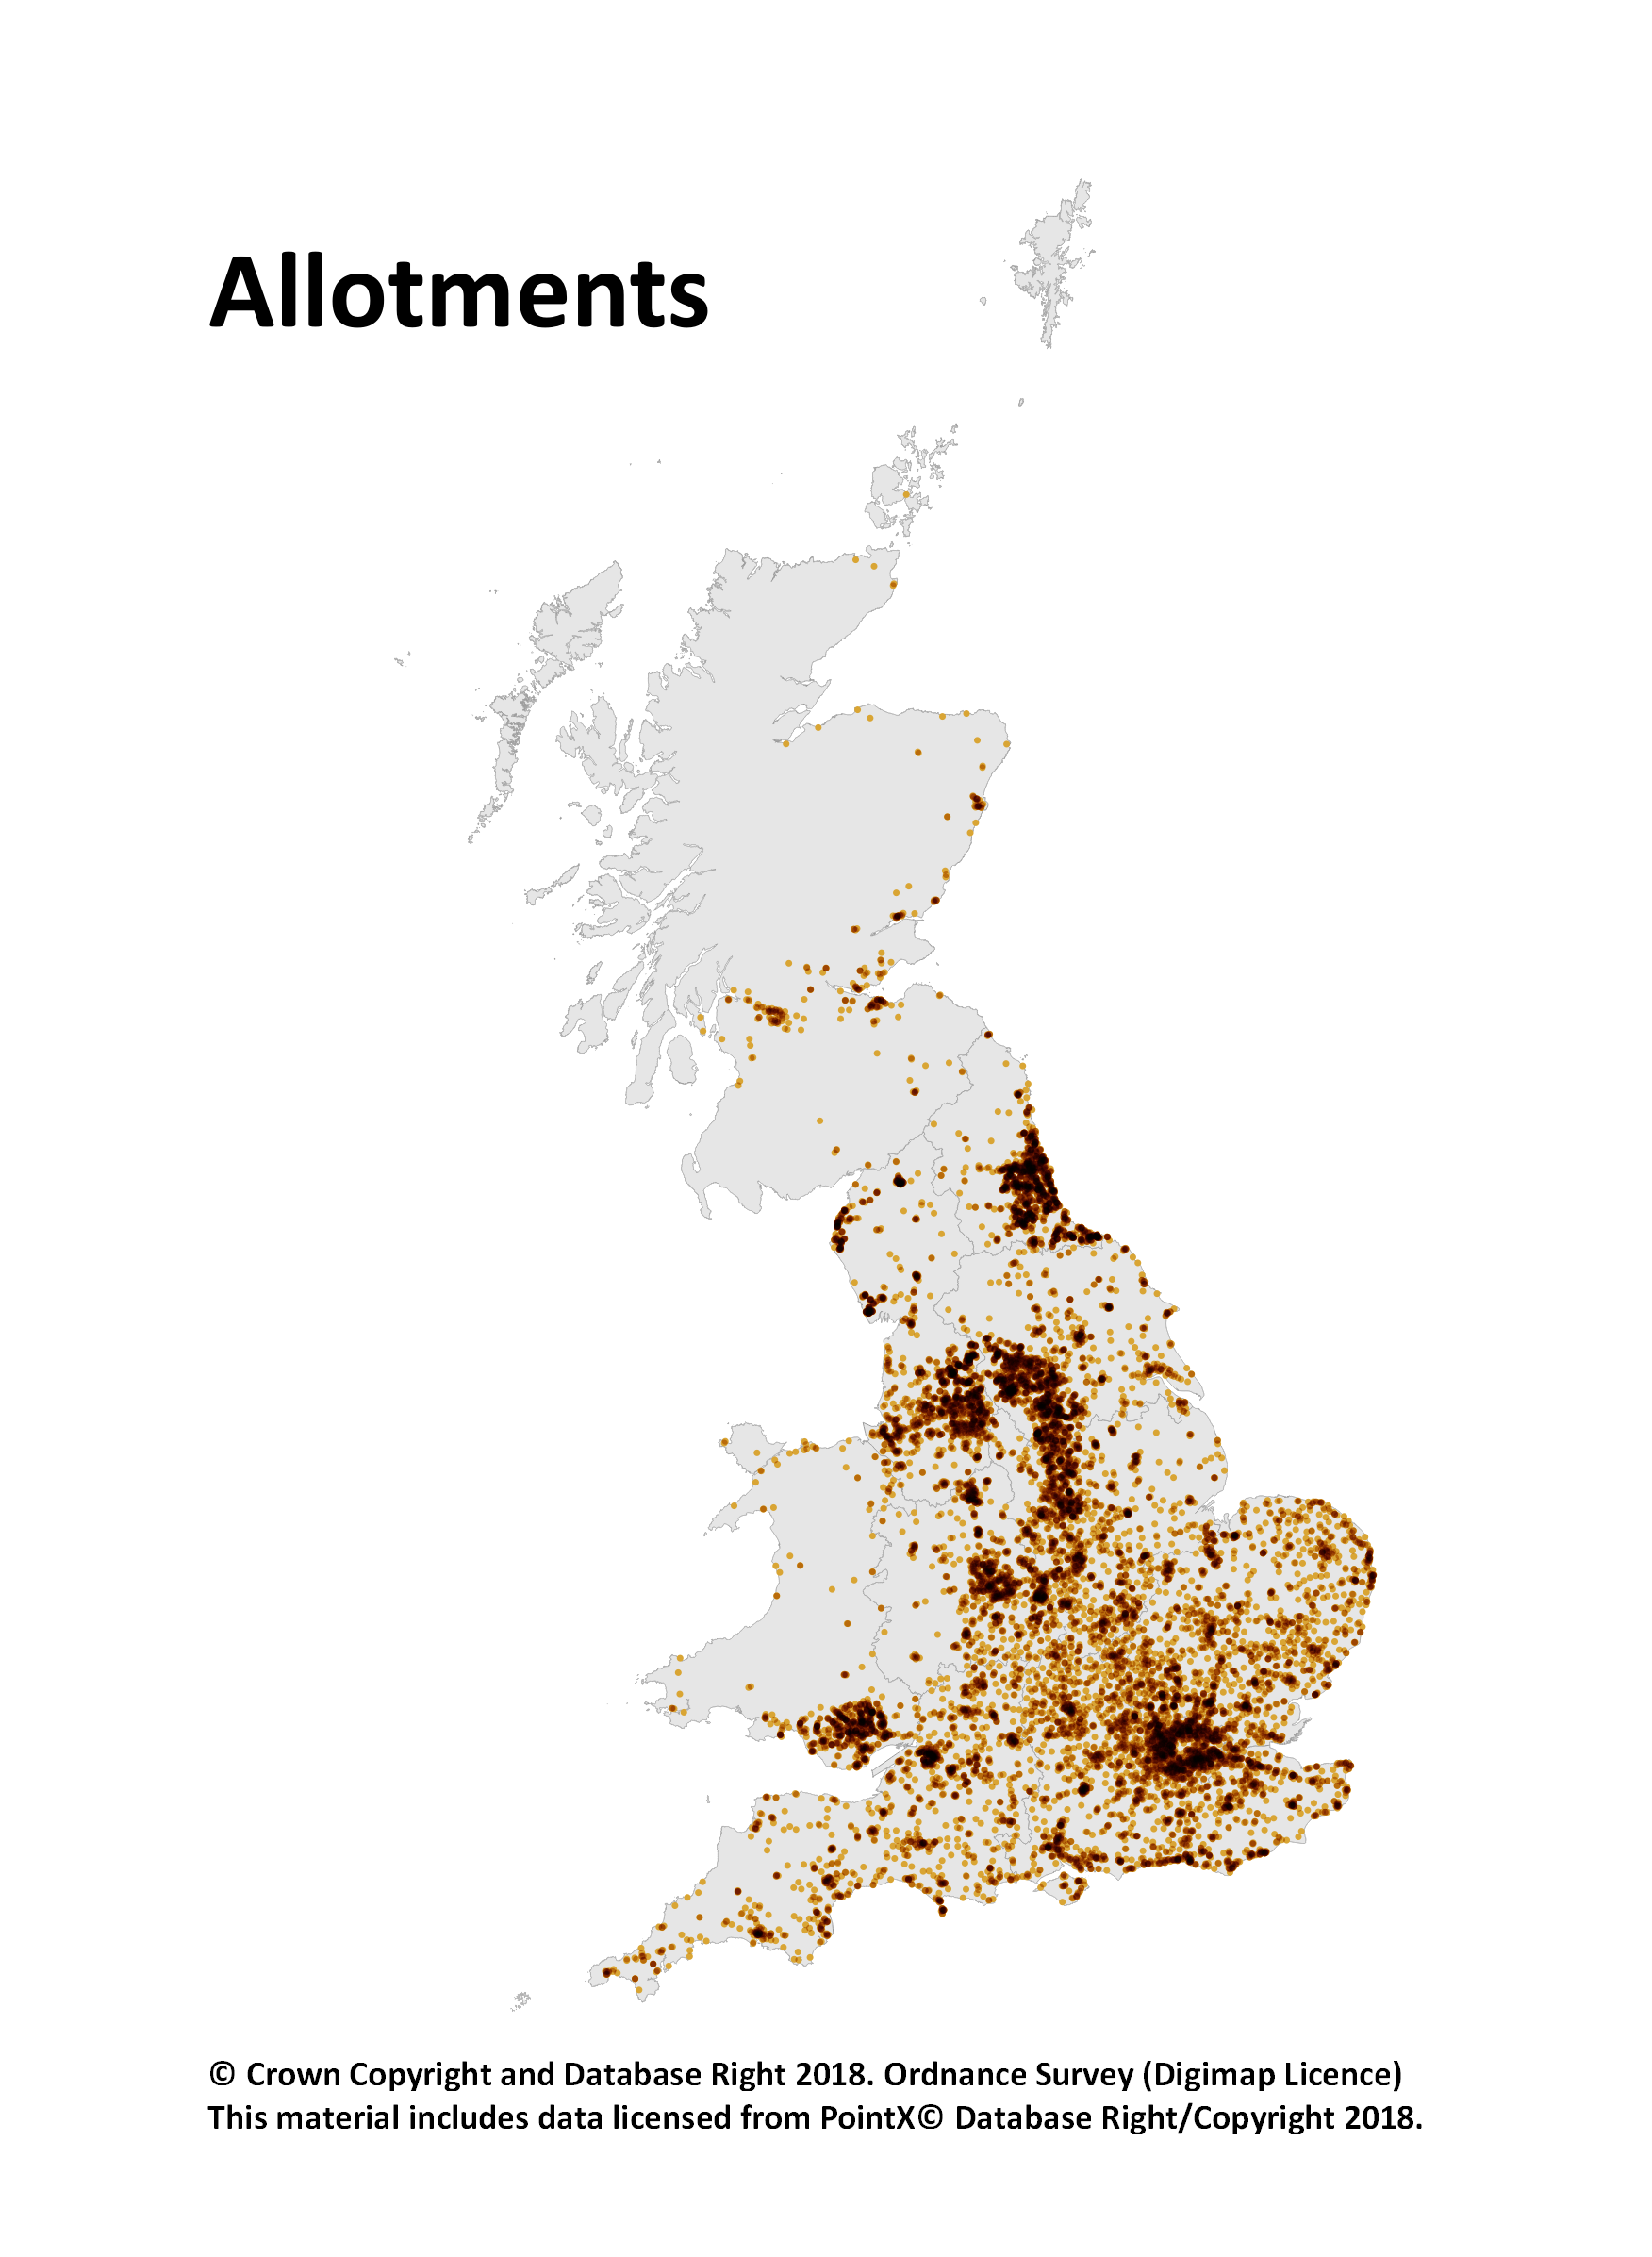
The Points of Interest (PoI) data is great for research and you can make fantastic looking maps too as we have been showcasing on our twitter account. You have certainly been making the most of it too, with 16,877 PoI downloads being made since May 2015. Here are 3 dot density maps we made to show a single class of PoI data:
However until today you had to take all the different classes of points for your specified area and you were limited to taking no more than 10,000 Km2 in a single download. As PoI data is split into 9 groups, 52 categories and over 600 classes (see the full scheme here), we though it would make things easier if we exposed some of this hierarchy in Digimap’s Data Download service.
You can now select one or more of the groups or categories to download, taking some of the data processing load off you and making your downloads more manageable. Being able to filter the features in your download by group or category means smaller downloads so we have also removed the limit on the area you can take; you can now take the whole country in one download if you want.
One note of caution though, the PoI data has around 4.5 million records and is over 1gb in size as a simple CSV file. So if you are taking national coverage you may want to only take one group or a few categories to minimise the amount of data you are dealing with.
To select a group or category of features simply add PoI data to your basket then use the drop down menu in the layers column to choose what you are interested in.
We hope that you find this change really improves the accessibility of the Points of Interest data, we look forward to seeing some of the interesting analyses and maps you produce!
EDINA were delighted to co-host an event with King’s College London exploring the benefits of Digimap. We were joined by a full complement of staff and students from both King’s College and other neighbouring universities at the impressive Bush House, and would like to offer our warmest thanks to staff at King’s College for making the arrangements.
We heard two fascinating talks from Dr Stuart Dunn (KCL) and Dr Stuart Brookes (UCL). Dr Dunn talked about the identification and mapping of corpse roads by combining different types of data from a variety of sources, including historical texts and map data from Digimap. These ancient pathways exist in several areas of the country but their location is shrouded in the mists of folklore.
Dr Brookes gave a fabulous insight into how our reading of historical landscapes can explain and inform the development of our country today and how maps and spatial data play a key part in this analysis. Not only can this analysis explain the past but can also begin to predict future developments. In particular he demonstrated how spatial data has assisted in demonstrating how ancient roads have impacted the growth of modern day transport networks and urban areas.
EDINA’s Director, Janet Roberts, gave a short talk about the value of Digimap and the use of data, highlighting particularly the importance of data skills to graduate employability and economic activity in both the short and medium term.
Both Dr Dunn and Dr Brookes have made use of a range of data from Digimap in their research and demonstrated the immense value that Digimap can bring to so many aspects of research and teaching. Having a wide range of data available in one place, with support available from EDINA, makes maps and map data easily accessible and usable for all staff and students from any discipline, novice and expert user alike.
This event was held in part to help broaden the use of Digimap at King’s College into more departments. There is a recognition that Digimap is a key resource at a high level at King’s College…
“An astonishing resource to have available which could be useful to all sorts of surprising research and teaching contexts across the faculty”
Professor Simon Tanner, Pro Vice Dean (Impact & Innovation), Arts & Humanities
… so we were very happy to do what we could to help. If you would like to showcase your own use of Digimap and promote the use of maps and spatial data throughout your institution, please get in touch (edina@ed.ac.uk). We look forward to co-hosting other similar events elsewhere.
EDINA is pleased to announce a new schedule of webinar dates. Some topics have yet to be confirmed. Please book a place….just click any webinar to go to the booking page.
If you have suggestions for other webinar topics relating to Digimap, please drop us a line on edina@ed.ac.uk or 0131 650 3302.
EDINA is very excited to be holding a joint event with King’s College, London on Thursday 22nd March 2018, exploring the benefits of Digimap . Watch this space for a write-up of the event. If you’re joining us, we’re looking forward to seeing you!
EDINA will be exhibiting at the Jisc Digifest 2018 conference on 6th and 7th March at the ICC in Birmingham. Come and talk to us about exciting developments with Digimap! We will have demonstrations of all the Digimap services and staff on hand to answer any questions. We will be at Pod 19 in the Exhibitor Zone and DigiLab area.
Digimap have scheduled two “open surgery” webinars, open to all Digimap users. These hour long sessions offer the opportunity for you to ask any questions you may have about Digimap.
EDINA Geo team
Our team have a wealth of experience of mapping data and can help you with:
using the service – how to get the map or data you need
personalising your map with annotations or data
the maps available within the service
using your data in GIS
copyright queries
We’d welcome questions about any aspect of the service, or if you’d just like to give us some feedback that would be very welcome. Hope to see you there.
Those with long memories will remember the launch of Digimap on 10th January 2000. This means that the service has just turned 18!
Much has changed since then, with a move from a single mapping application to “lite” and advanced versions through to the recently updated Roam mapping application available today. Changes in web mapping technology have moved on apace, licensing has developed considerably, the range of data available within Digimap has expanded and the number of users and range of uses has increased exponentially. Digimap has enjoyed many ringing endorsements over the years and EDINA will continue to ensure that Digimap offers value and benefit to the academic sector. Happy Birthday Digimap!
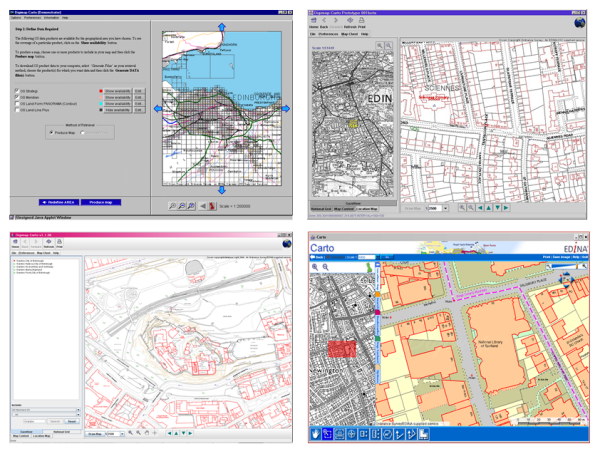
Four versions of Digimap Carto, the advanced mapping tool. Technology now allows us to combine both simple and advanced functionality into a single application, which we now know as Roam!
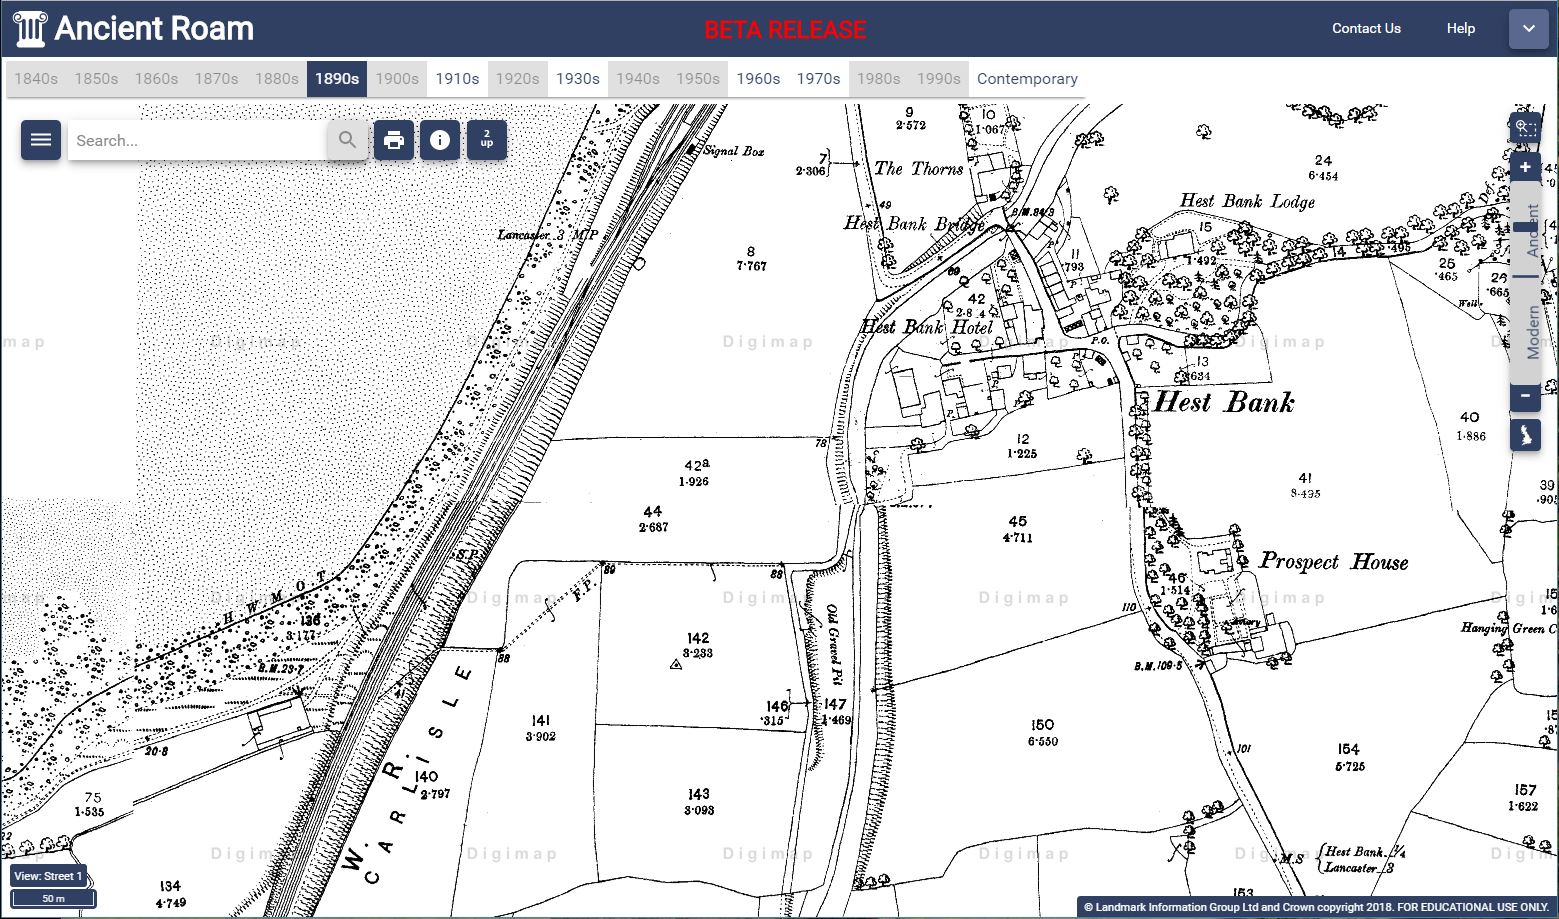
2018: Ancient Roam from the Historic Digimap Collection