Any views expressed within media held on this service are those of the contributors, should not be taken as approved or endorsed by the University, and do not necessarily reflect the views of the University in respect of any particular issue.
Digimap is an online map and data delivery service, available by subscription to UK Higher and Further Education establishments. Operated by EDINA at the University of Edinburgh, Digimap offers a number of data collections, including Ordnance Survey, historical, geological, aerial photography, LiDAR, marine maps, land cover mapping, global mapping and census data. For more information about Digimap go to our website: https://digimap.edina.ac.uk Background image Contains OS data (c) Crown Copyright and database right 2022
Over the next few weeks we will be running a programme of webinars covering updates to Digimap, Global and Society Collections and the Ordnance Survey Northern Ireland data, including how you can access these new services. A separate webinar to discuss and answer any questions on data licences will also be scheduled.
The first webinar will be on Thursday 16th May (13:00-13:45) where we will demonstrate all the recent and forthcoming changes. There will be ample opportunity to ask questions but places are limited so please register online if you wish to attend.
Don’t worry if you can’t make this webinar, it will be repeated on 23rd May and 30th May, details and registration links can be found on our Events page.
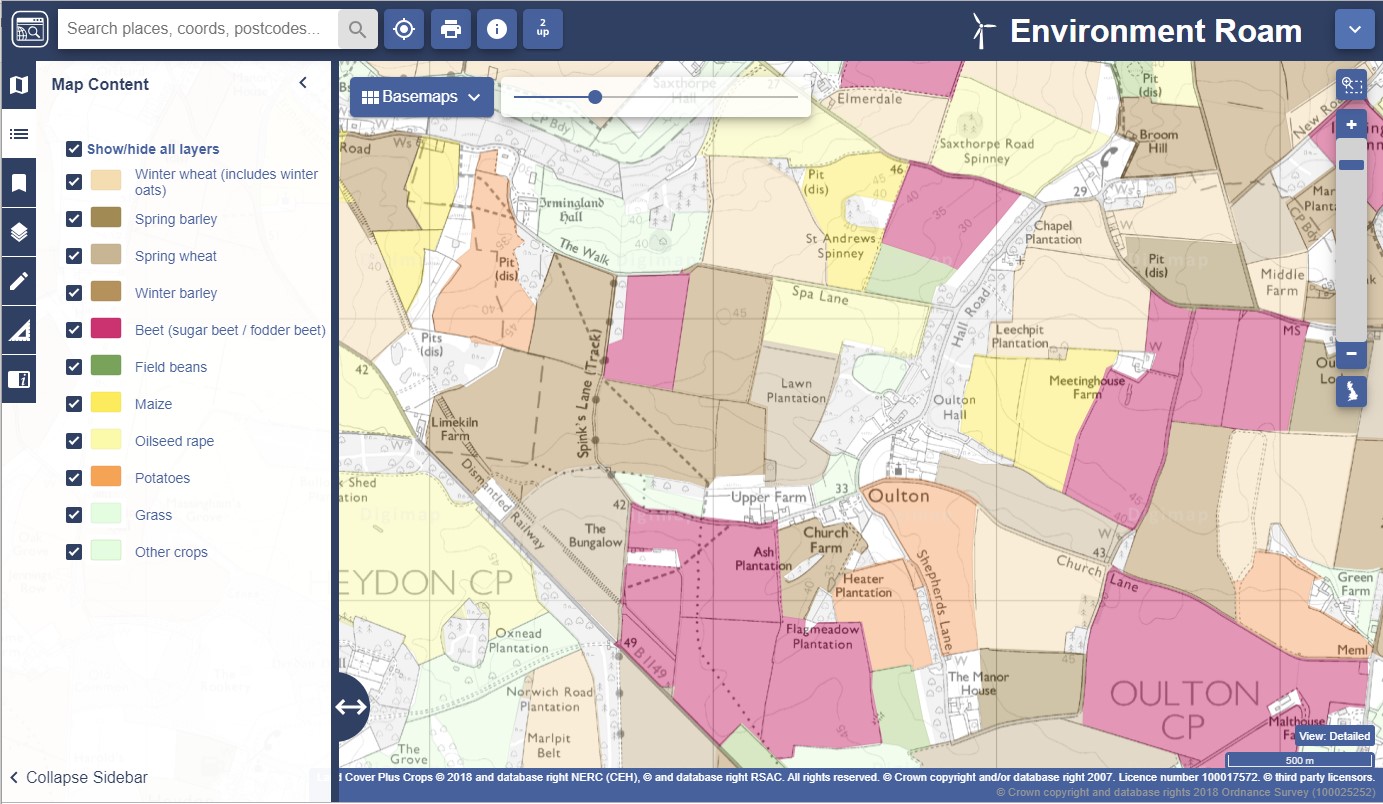
CEH Land Cover® Plus: Crops has been produced by the Centre for Ecology & Hydrology in partnership with Remote Sensing Applications Consultants and provides annually updated arable crop information for the whole of Great Britain. You can read more about it in our previous blog post.
You can find the 2018 data under the Basemaps in Environment Roam and under the Crop Data heading in Environment Download.
All Digimap users currently have free access to Global Digimap until 31st July 2019 as a trial. We hope you like this new service. If you would like to learn more about the OpenStreetMap data, it’s origins and history, from someone who is more than qualified to tell the story, Steve Chilton is giving a talk at #geomob in London on 19th June 2019 about this very subject.
Last week we granted access to two new Digimap collections for all registered Digimap users. All Digimap users now have access to Global Digimap and Society Digimap. You should have received an email about this on Thursday 21st March.
The free trial will run until 31st July 2019. Access beyond that date will require your institution to have a subscription.
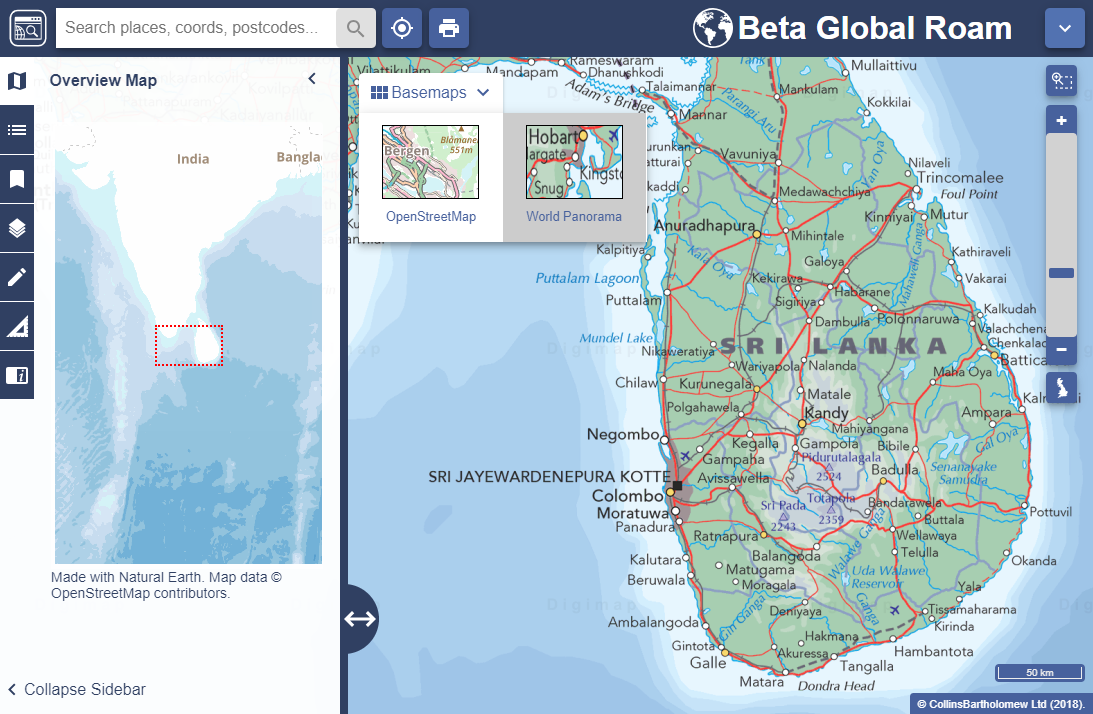
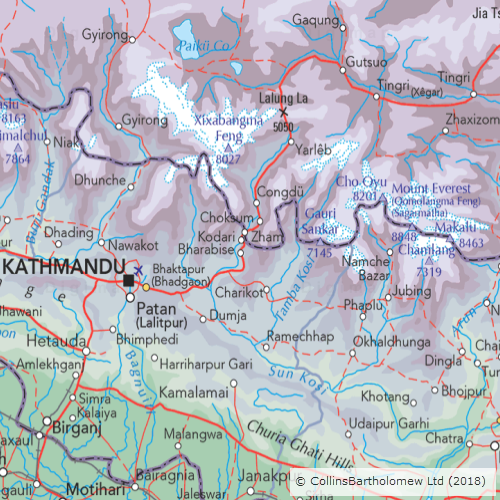
Global Digimap offers three datasets for mapping and data download: Open Street Map, Natural Earth and Collins Bartholomew World Panorama maps.
We are really keen to know what you think of the service and the data available. You can complete our online feedback form to tell us. We can’t answer questions submitted through this form; please contact our helpdesk if you need assistance.
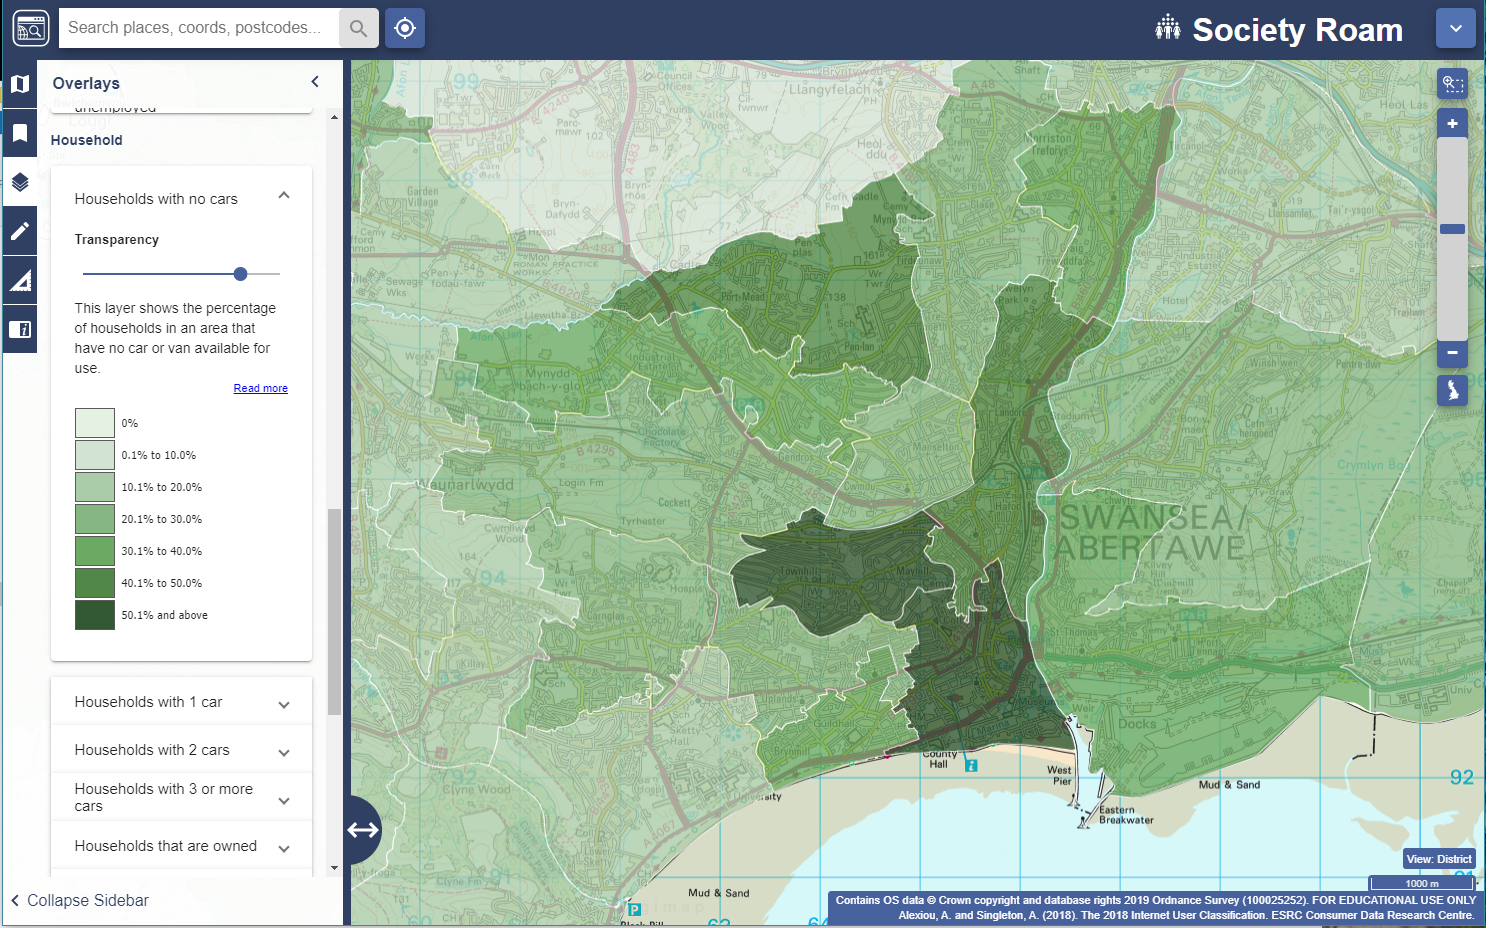
Society Digimap offers a wealth of census and socio-economic data for Great Britain. This includes over 40 layers of data from a range of 2011 Census data, broadband availability and Output Area Classification (OAC). The complexity of census data is sometimes off-putting, despite the tremendous insights it can offer. Society Digimap aims to provide easy access to some key variables as an introduction to these complex data.
We are still working on providing a Data Download facility and a print facility for Society Roam, among other things. If you have suggestions on what else you would like to see in Society Digimap, we’d love to hear your views through our online feedback form. Please note that we cannot respond to queries submitted through this feedback form. If you need help, please get in touch: digimap@ed.ac.uk
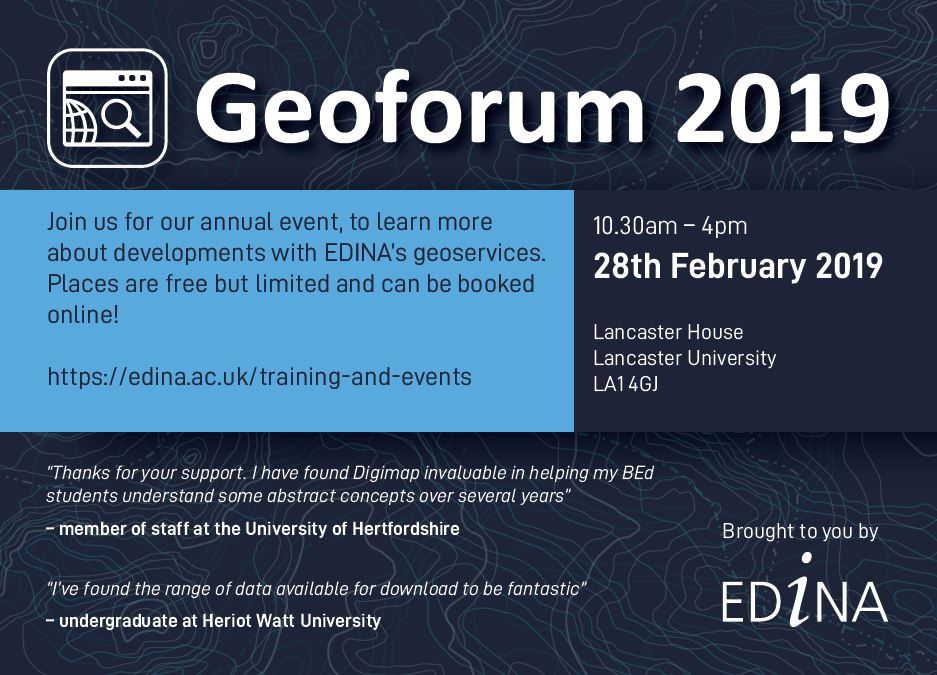
We are very pleased to share our provisional programme for this year’s GeoForum event on Thursday 28th February 2019 at Lancaster House, Lancaster University, LA1 4GJ.
GeoForum is a free all day event aimed at lecturers, researchers and support staff who promote and support the use of geospatial data and services at their institution. Throughout the day we there will be talks and demonstrations to showcase recent geospatial developments at EDINA and opportunity to offer your feedback on the services we provide and discuss geospatial issues with the EDINA team.
This beautiful new addition to Global Digimap is an excellent addition providing a wonderful cartographic product ideal for small scale extents.
EDINA feel this addition, available via it’s ‘Alternate Base Map’ function is a perfect enhancement to the collection. With it’s origins in The Times Atlas, World Panorama exemplifies what is best about a mapping product where cartographic presentation is at the fore. With a geopolitical committee sitting behind the product, providing input on boundaries and territory disputes it is the epitome of an authoritative dataset. This provides excellent comparison to OpenStreetMap, a massive crowd-sourced dataset of volunteered geographic information.
Available as a raster product and still to be added to Data Download, EDINA are keen to hear if this mapping product is attractive to you as a core offering in Global Digimap. If you have any comments about this new addition, please do let us know using the details below.
Webinar
We are running another short webinar on Global Digimap on Wednesday 9 January from 13:00-13:30 where we will showcase the new dataset as well as talk about the latest developments and additions to the service. There will also be plenty of opportunity to ask any questions you may have about the service and suggest any improvements you would like to see. Places are limited, so please register using the link below if you wish to attend:
As advertised earlier this year, the previous versions of Roam and Data Download will be withdrawn from service on 8th December 2018.
Since we understand that transition from one version to another takes time, both new and old versions have been running in parallel for many months now. The upgraded Roam and Data Download applications have been available since November 2017 and June 2018 respectively. These are both easier to use, more flexible on a range of devices and offer a more modern, slick user experience. Feedback on both has been very positive. Full instructions on how to use the new applications are available in the Digimap help pages. The data available remains identical.
New versions of Roam and Data Download
We continue to work to improve the facilities Digimap offers and hope to have some new developments avaliable over the coming months. If you have any questions about the withdrawal of the two older applications or any feedback or requests regarding the new applications, please do not hesitate to contact us.
We are very pleased to confirm the date and venue for our next GeoForum event and invite you to join us for an interesting programme, with a range of speakers and opportunities for discussion.
Please do save the date. We hope to focus on the recent addition of the CEH Land Cover Plus: Crops dataset to Environment Digimap, Global Digimap and the OpenStreetMap data as well as mapping data for Northern Ireland.
GeoForum is a free all day event aimed at lecturers, researchers and support staff who promote and support the use of geospatial data and services at their institution. Throughout the day we there will be talks and demonstrations to showcase recent geospatial developments at EDINA and opportunity to offer your feedback on the services we provide and discuss geospatial issues with the EDINA team. The confirmed programme will be posted here when available.
We are delighted to announce that Environment Digimap now offers the CEH Land Cover® Plus: Crops dataset. CEH Land Cover® Plus: Crops has been produced by the Centre for Ecology & Hydrology in partnership with Remote Sensing Applications Consultants and provides annually updated arable crop information for the whole of Great Britain.
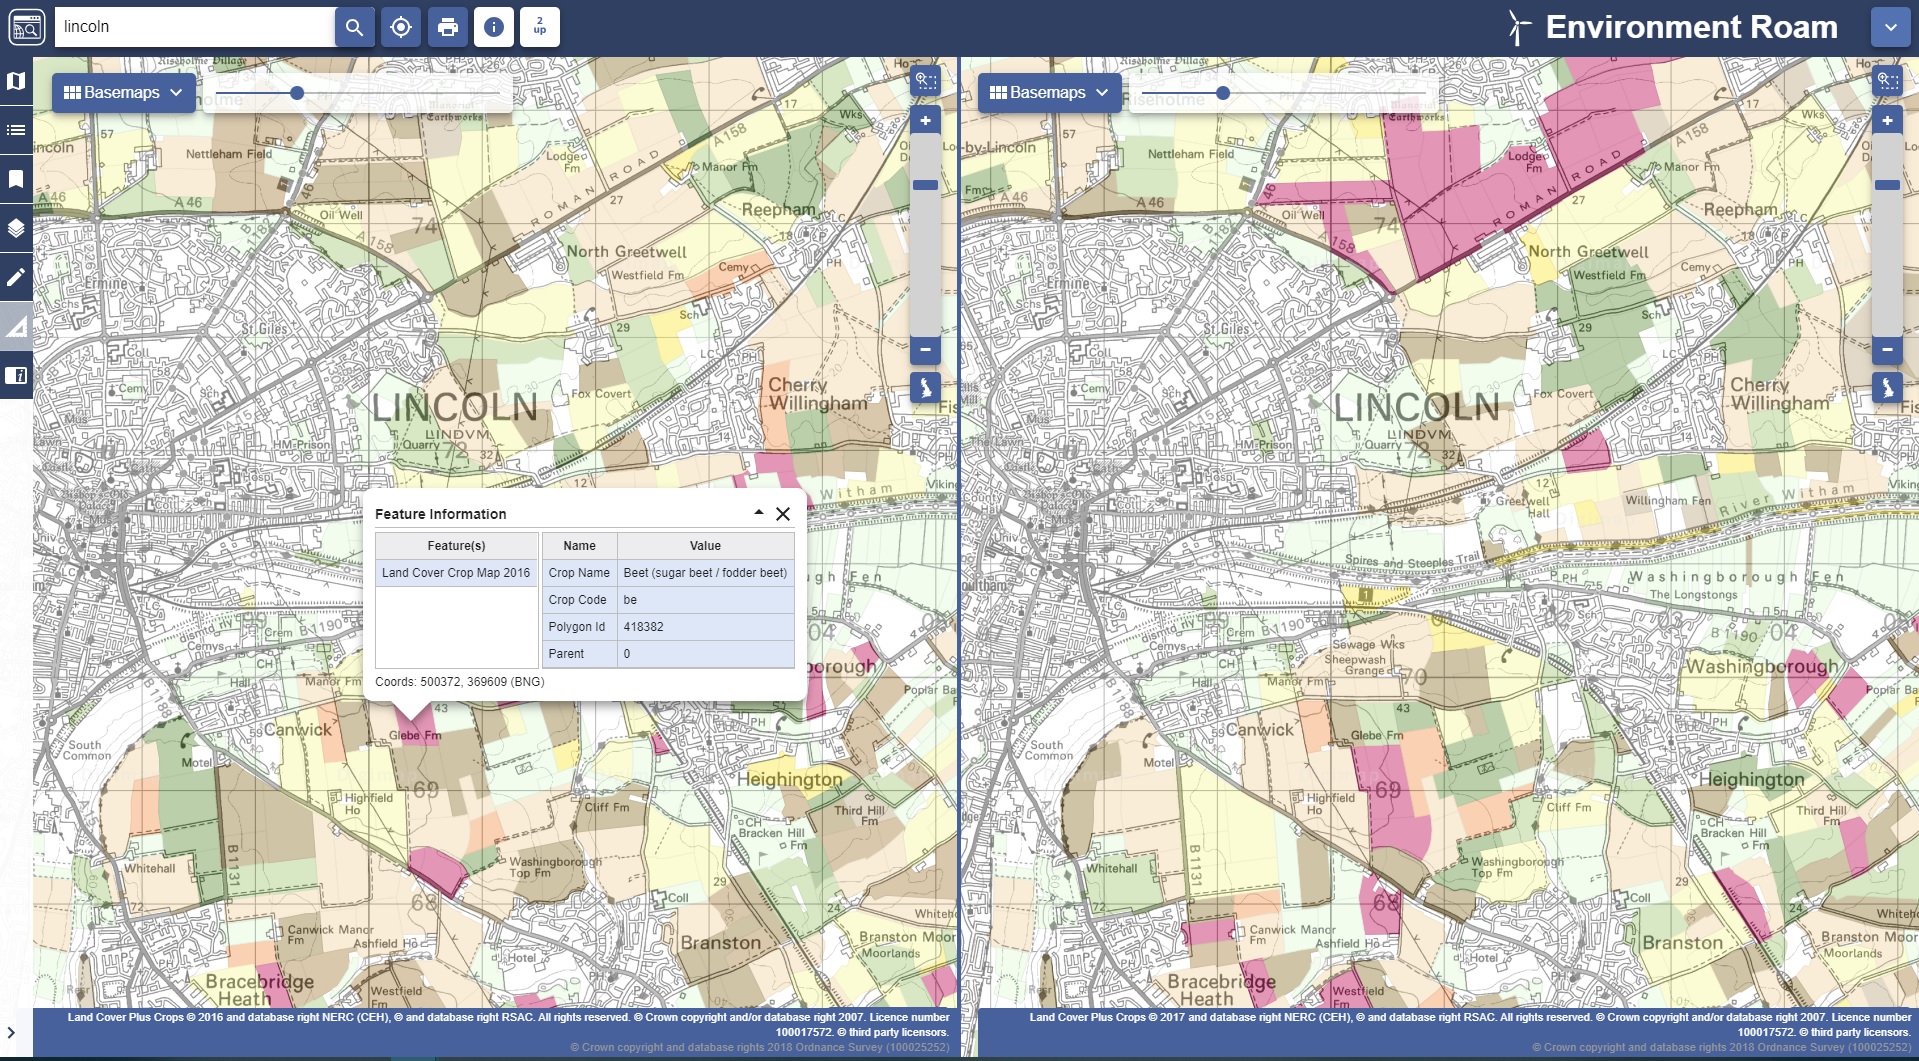
Environment Digimap is the only platform dedicated to the academic sector offering this data. CEH Land Cover® Plus: Crops data is available for both 2016 and 2017. Environment Digimap’s Roam application has the new datasets displayed as alternative basemaps, allowing you to compare the two years side by side using the “2-up” map function. The opacity slider also enables the underlying context map to be viewed easily.
The Info Tool also enables you to query the Crops data, giving information about the crop name, code, the polygon identifier and the coordinates of the point chosen. All other functions in Roam operate as usual, including the ability to annotate measure and print. The Map Content is also available in the left hand panel to help you identify crop types.
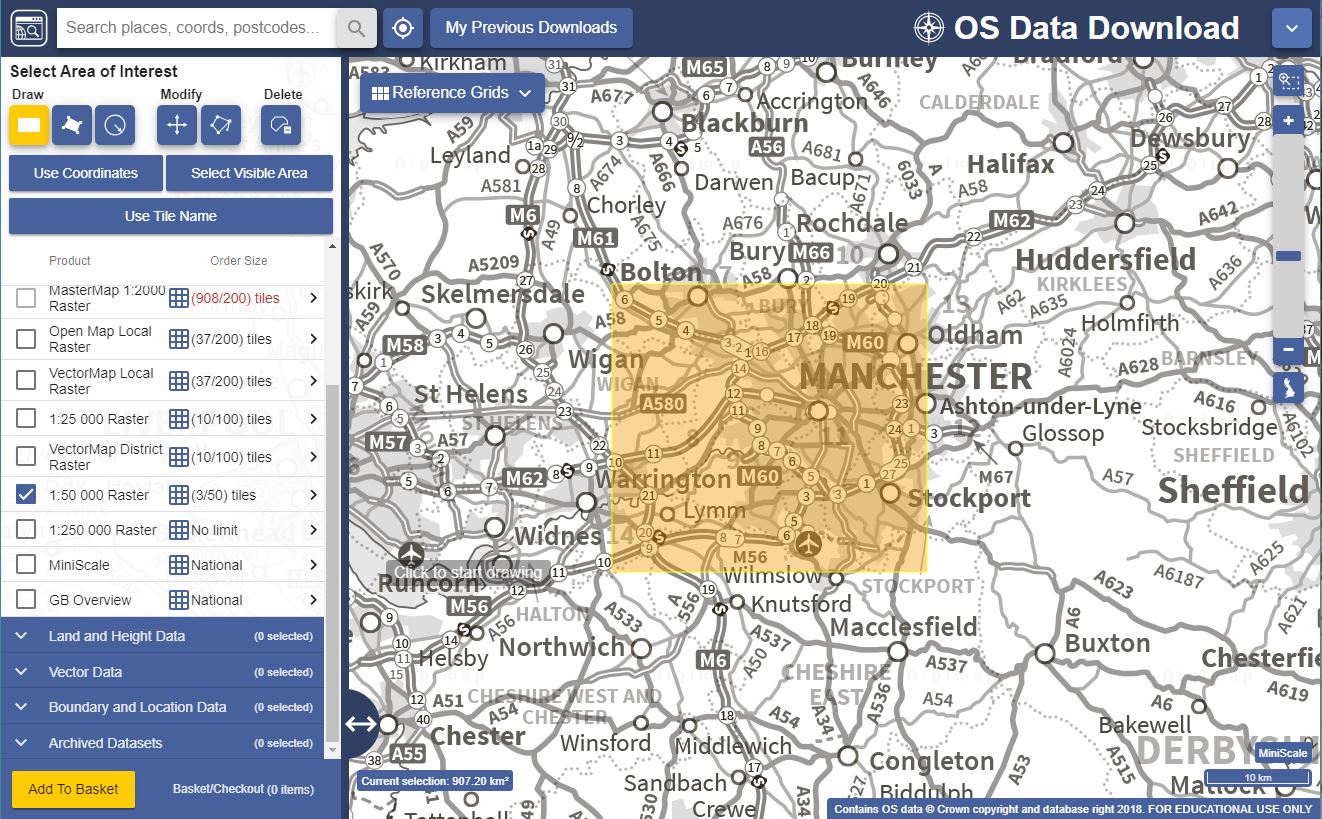
The CEH Land Cover® Plus: Crops data is also available to download from Environment Download. Select your area of interest as usual, add the Crop data to your basket and select from File Geodatabase or GeoPackage as optional formats. You can also choose to select individual crop layers rather than the full suite if you wish.
If your institution has a subscription to Environment Digimap, this dataset is available at no additional charge. If your institution does not have a subscription to Environment Digimap, prices and details of the subscription process can be found on our website.*
*Please note that in order to place a subscription order you must be a suitably authorised member of staff. If you have any questions about this, please don’t hesitate to contact us.

 Over the next few weeks we will be running a programme of webinars covering updates to Digimap, Global and Society Collections and the Ordnance Survey Northern Ireland data, including how you can access these new services. A separate webinar to discuss and answer any questions on data licences will also be scheduled.