Any views expressed within media held on this service are those of the contributors, should not be taken as approved or endorsed by the University, and do not necessarily reflect the views of the University in respect of any particular issue.
Digimap is an online map and data delivery service, available by subscription to UK Higher and Further Education establishments. Operated by EDINA at the University of Edinburgh, Digimap offers a number of data collections, including Ordnance Survey, historical, geological, aerial photography, LiDAR, marine maps, land cover mapping, global mapping and census data. For more information about Digimap go to our website: https://digimap.edina.ac.uk Background image Contains OS data (c) Crown Copyright and database right 2022
Our next GeoForum 2020 will be held on Tuesday 3rd March 2020 at the Informatics Forum, University of Edinburgh, 10 Crichton Street, Edinburgh, EH8 9AB
Places are limited so please book early to avoid disappointment.
Our provisional programme is as follows and may be subject to change:
‘From mapping demolished buildings to estimating urban productivity: Applications of large scale spatial data in urban analytics.’
Dr Genevieve Patenaude, Deputy Director of Research, School of Geosciences, University of Edinburgh
Coffee
EDINA Workshop on New Data Options
Summary and questions
16:00 Close
This year we are also delighted to invite you to a pre-GeoForum event, a private guided tour of the Da Vinci Exhibition, currently on display at The Queen’s Gallery in the Palace of Holyroodhouse. This will take place from 6-8pm on Monday 2nd March. You can book your place for the private tour here.
Geoforum is a free all day event aimed at lecturers, researchers and support staff who promote and support the use of geospatial data and services at their institution.
Friday 10th January sees Digimap reach the grand old age of 20! There are still a few EDINA staff who remember the exciting day we launched the national service after 3 years of pilots and projects. Our initial data licence was for 4 years and we have gone from strength to strength since then, expanding both the range of data offered and the tools that interact with it. We anticipated 40 subscriptions within the first year; we had 70 within the first month!
Digimap was born in the early days of web based mapping and we are delighted that we are able to continue to develop and grow the service to keep up with changing times, and that it continues to help and support an enormous range of research and teaching across all discplines and at all levels. Roll on the next 20 years!
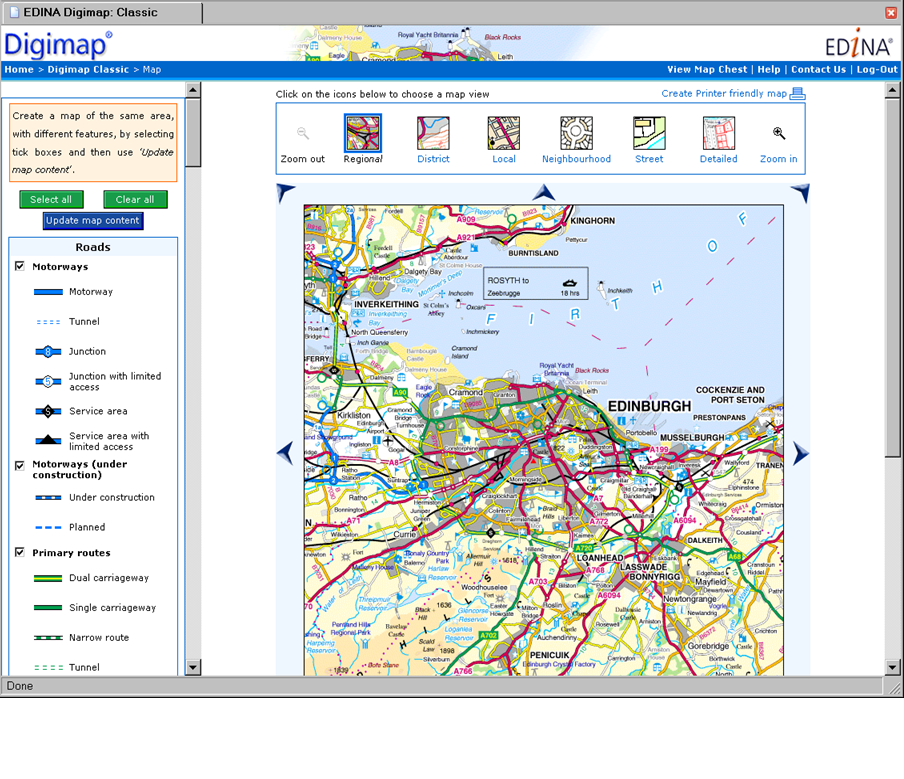
Indulge us…..here is an image of the second version of Digimap Classic – the precursor to Roam.
We are very pleased to announce the addition of a new collection of datasets to Digimap’s Ordnance Survey Collection. EDINA has partnered with Improvement Service to bring you a range of 37 datasets from Scottish Local Authorities. These are available at no additional charge upon agreement to the institutional sub-licence.
Once your institution has agreed to the sub-licence, all users will need to agree to the end user licence to have access to the data via the OS Data Download facility. To agree to the licence, log in to Digimap, go to Licence Agreements (top right) and find the Improvement Service licence at the bottom of the list. Once you have agreed to this, the data will be visible.
To access it, go to the left hand panel in Data Download and look for the section labelled “Improvement Service – Scotland”. All 37 datasets are listed in this section.
Although the availability grid indicates Scotland-wide coverage for every dataset, some local authorities do not provide every datasets.
We are very pleased to confirm a new date and venue for our next Geoforum event and invite you to join us for an interesting programme with a range of speakers and opportunities for discussion.
Geoforum will be on Tuesday 3rd March 2020 at the Informatics Forum, University of Edinburgh 10.30am – 4pm.
Please do save the date. We aim to showcase different uses of the data downloaded from Digimap by researchers from a number of disciplines. There will also be a workshop session led by EDINA offering opportunity for discussion and feedback. We look forward to seeing you!
Geoforum is a free all day event aimed at lecturers, researchers and support staff who promote and support the use of geospatial data and services at their institution. The confirmed programme will be published here on our blog and distributed by email when available.
Following the announcement of the general election for Thursday 12th December we have taken the difficult decision to postpone the GeoForum, due to be held in Edinburgh on Thursday 12th December.
We are aiming to reschedule the event for the spring of 2020 so will post details of a new date here as soon as possible.
GeoForum is a free all day event aimed at lecturers, researchers and support staff who promote and support the use of geospatial data and services at their institution. We hope that you will be able to join us for the next one.
**UPDATE** This event has been postponed until Spring 2020. Watch this space for further details
We are very pleased to confirm the date and venue for our next Geoforum event and invite you to join us for an interesting programme, with a range of speakers and opportunities for discussion.
Geoforum will be on Thursday 12th December 2019 at the Bayes Centre, University of Edinburgh 10.30am – 4pm.
Please do save the date. We aim to showcase different uses of the data downloaded from Digimap by researchers from a number of disciplines. Topics include green space and mental health, satellite data and solar energy. There will also be a workshop session led by EDINA offering opportunity for discussion and feedback. We look forward to seeing you!
Geoforum is a free all day event aimed at lecturers, researchers and support staff who promote and support the use of geospatial data and services at their institution. The confirmed programme will be published on our blog and distributed by email when available.
For those people in FE colleges using our Digimap for Colleges service, the following will be important. Digimap for Colleges is available to Further Education Colleges only.
From 31st December 2019 Digimap for Colleges will be no longer be available.
Access to the same maps (and substantially more) continues to be provided through our comprehensive Digimap service. You can learn more about this service here.
Subscriptions to Digimap are available at any time from now onwards and prices are available on our website. Note that these prices are for a full annual subscription and will be pro-rated from the date your subscription starts. If you would like to purchase a subscription for your institution, please contact us at edina@ed.ac.uk.
At EDINA we aim to create resources which are aligned with the needs of our subscribers. Furthermore, we are dedicated to providing access to the very best digital tools, helping learners in the FE sector to gain valuable skills that prepare them for employment. Continual investment in the staff and infrastructure that underpin our services is a necessity and this impacts the sustainability of free-to-use resources. As a consequence, operating and maintaining a free Digimap for Colleges service is no longer viable for us. However, the well-established and well-respected Digimap service provides a more flexible, powerful and comprehensive tool offering significant value and benefits.
Please do not hesitate to contact Guy Stevenson with any questions you may have.
We are pleased to announce that two new data products from the Centre for Ecology and Hydrology are now available to download through Environment Digimap.
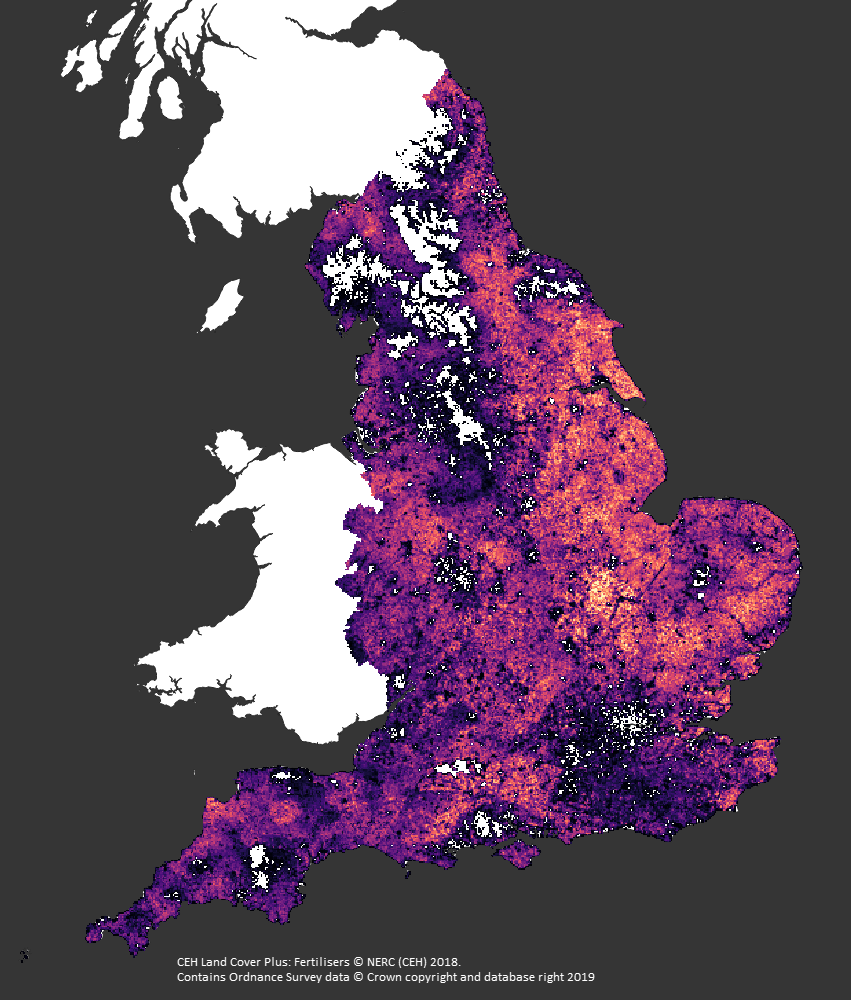
By combining information on cropping patterns from CEH Land Cover®plus: Crops (a dataset also available through Environment Digimap) with national survey data on pesticide and fertiliser use, the Centre for Ecology & Hydrology has created two new data products: CEH Land Cover®plus Fertilisers and CEH Land Cover®plus Pesticides.
CEH Land Cover plus: Fertilisers dataset for England
CEH Land Cover®plus Fertilisers dataset covers England only. CEH Land Cover®plus Pesticides covers England and Wales. Both datasets are available to download from Environment Download.
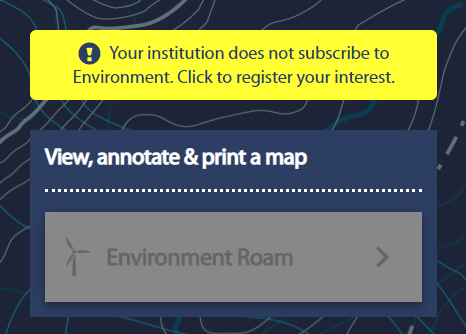
If your institution does not yet have a subscription to Environment Digimap, you can register your interest in this collection on the Environment Digimap home page once you have logged in.
Over the last month or so, following feedback from users of the Digimap service, we made a few additions and enhancements to Digimap. We will be running a webinar on these early in the new term but here is a quick run down of the new features:
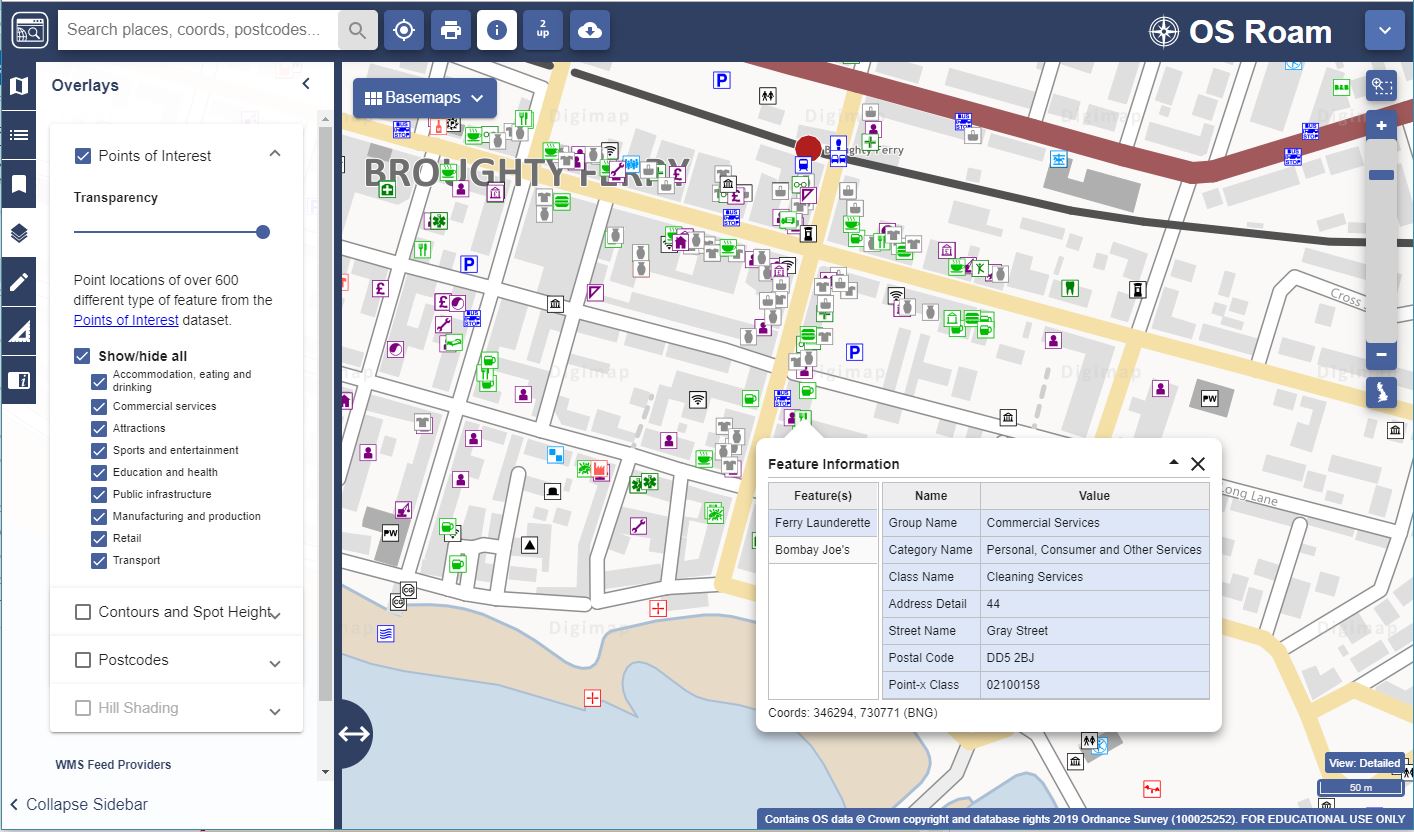
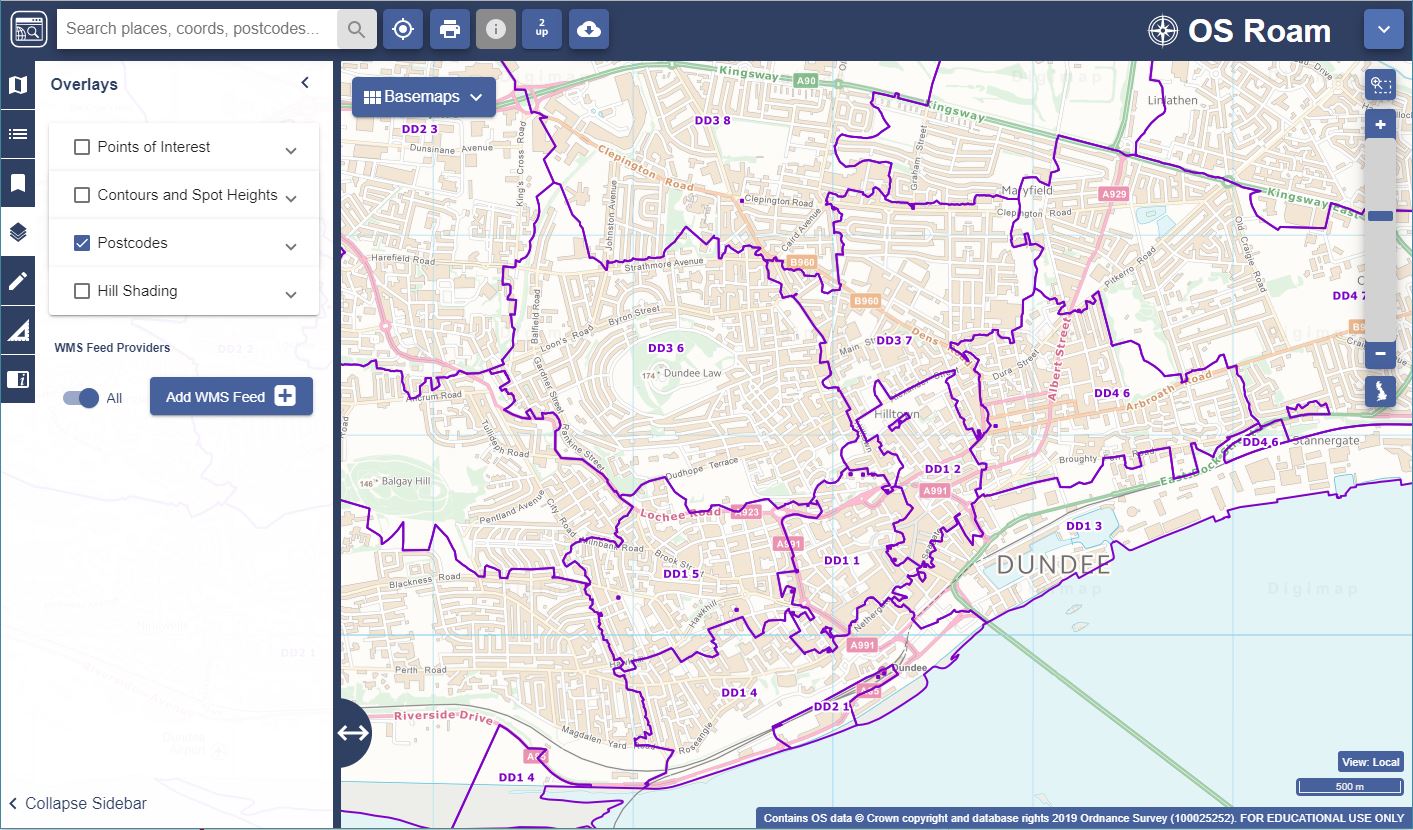
New Overlays added to OS Roam: Points of Interest (POI), Contours, Spot Heights and Postcode boundaries
Ability to view attributes of the POI, Contours and Spot Heights Overlays using the Information Tool
A5 printing in PDF, PNG and JPG now available in Roam
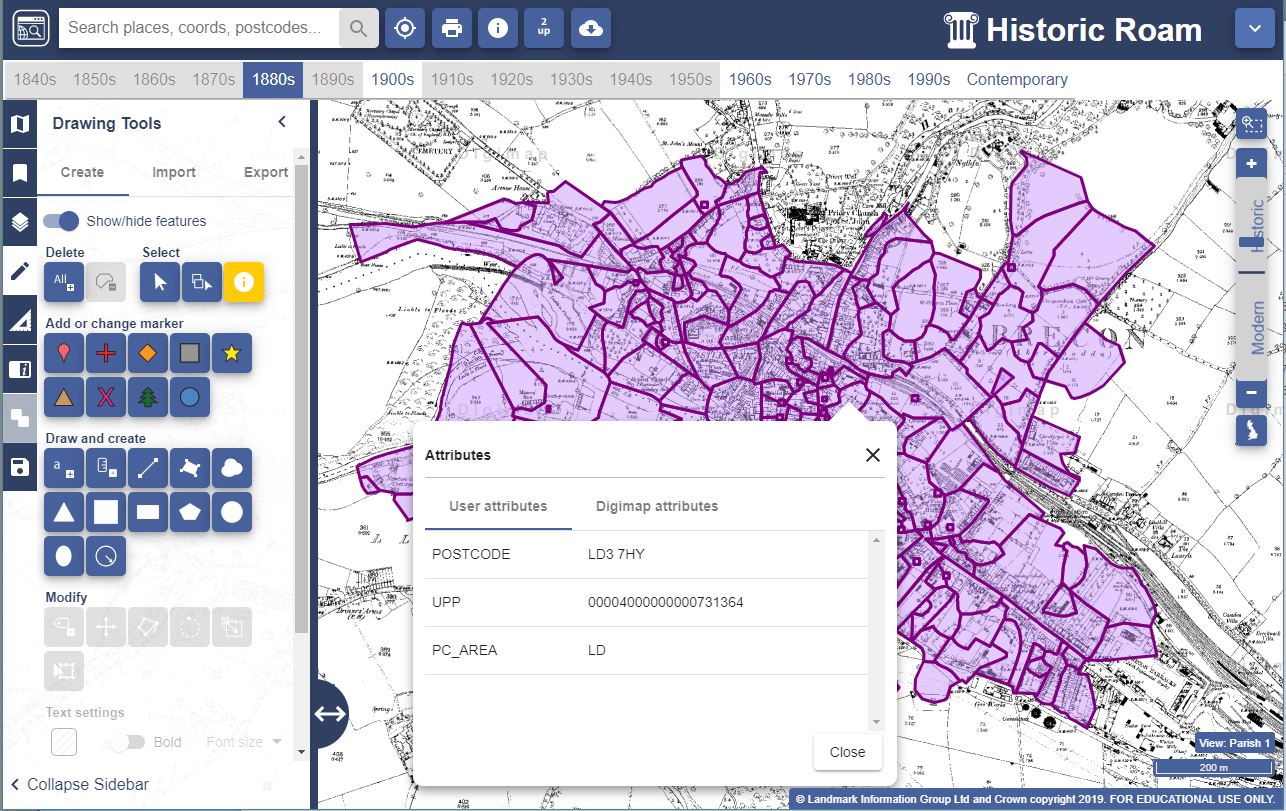
Ability to view attributes for imported data
Search results are now split into tabs
Digimap data now available via Web Map Service (WMS) feeds allowing the data to be streamed directly in to GIS applications and other Digimap Collections
Transparency slider added to all basemaps allowing you to fade out the basemap so that additional data stands out more clearly
Overlays
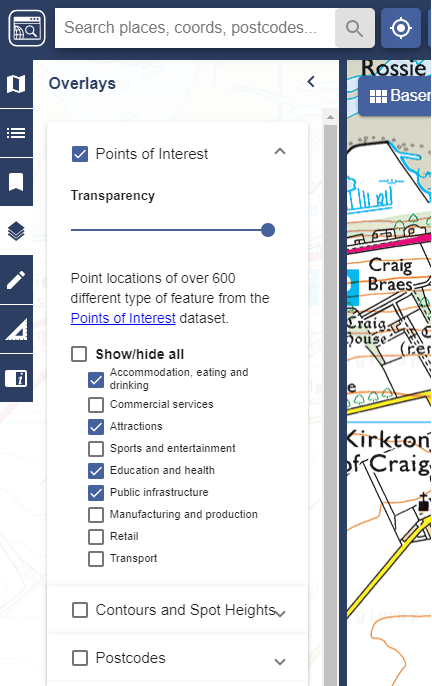
All Overlays in OS Roam can be found in the Overlays panel on the left hand side. Each Overlay has independent settings which allow control of the transparency of the Overlay layer and the ability to control which elements of the Overlay dataset are visible (or not). When printing a map which contains customised overlays, the customisation will not appear on your printed map. This means that if you select only one POI category on the screen, all POI categories will appear on the printed map. This is something that will be improved in the future.
Some overlays can be customised
It is also possible to view the attributes of the new Overlays using the Information tool in the header bar of the main window. Clicking on an Overlay feature will display the attribute information available for the feature. This includes, in the POI dataset, what type of business is represented, the address and postcode as well as the business or feature’s name.
Points of Interest data displayed as an overlay can now be queried using the Information tool.Postcode boundaries overlay shown with OS VectorMap District
View attributes of uploaded data
It is now possible to view the attributes of datasets loaded in to Roam. A variety of common spatial data formats, including Shapefile, GeoJSON and KML can be imported using the Drawing Tools > Import function. Once imported, attributes associated with each feature can be viewed using the Information tool. Below is an example of some imported postcode polygons with the Information tool identifying the postcode of the selected polygon.
View attributes of datasets imported in to Roam
Improved search results
We’ve made a small improvement to the way search results are displayed. When you search for a term, the results are now displayed in tabs according to the type of object you’ve searched for (Places, Roads, Postcodes and Grid References). This means that it’s much easier to find the result you want in a long list.
Search results are now separated into tabs
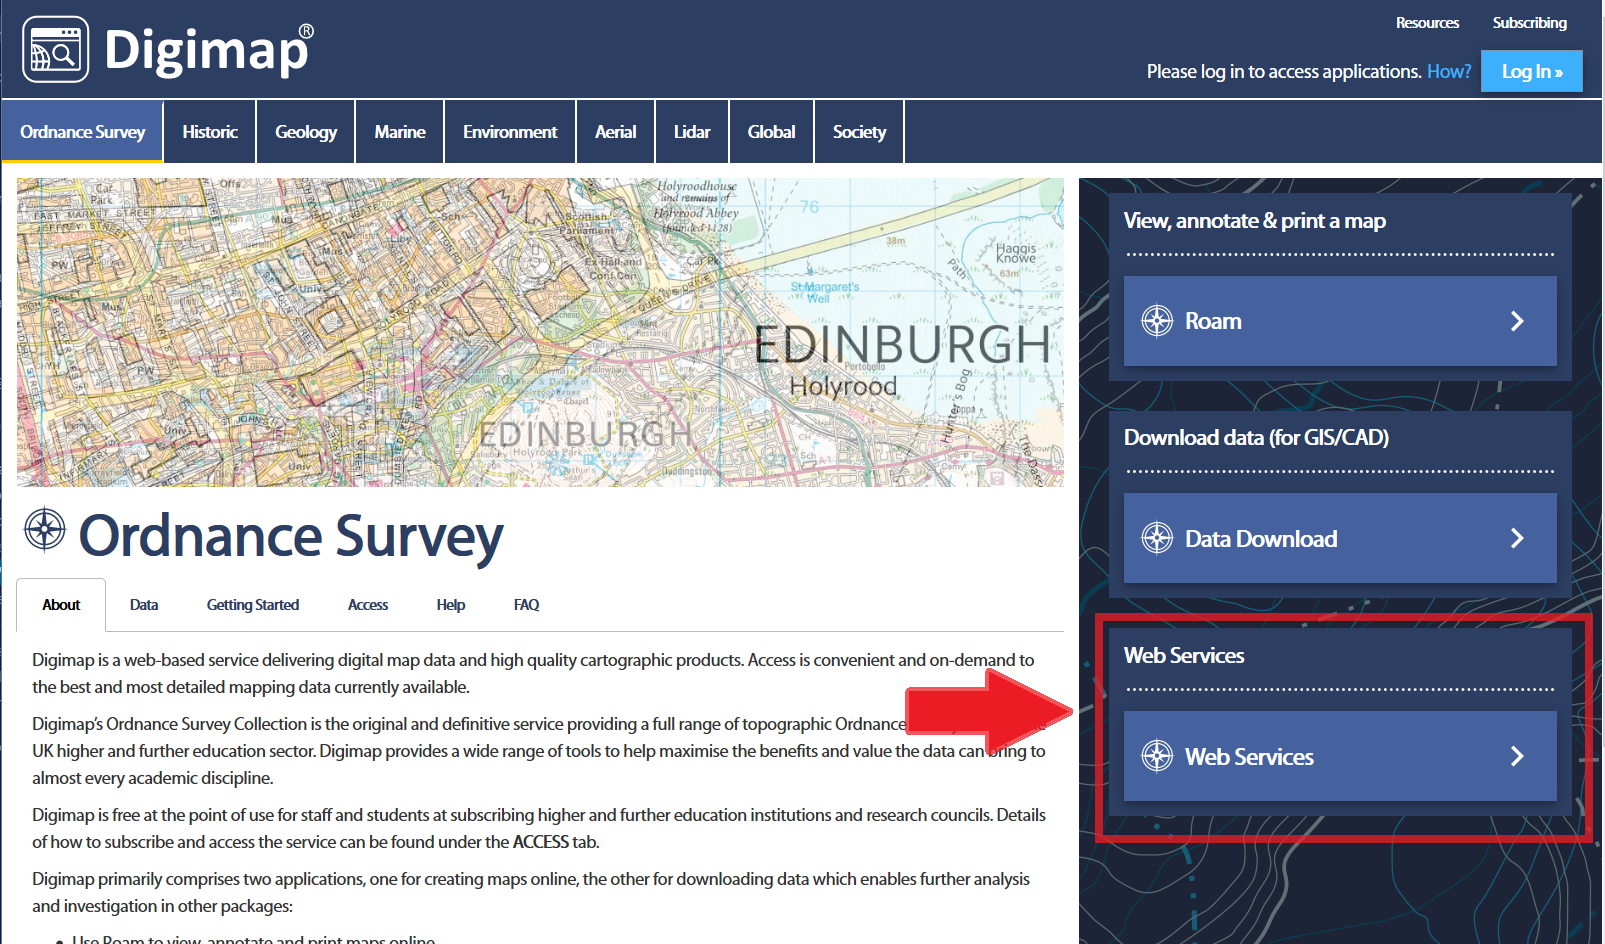
Digimap data now available as WMS feeds
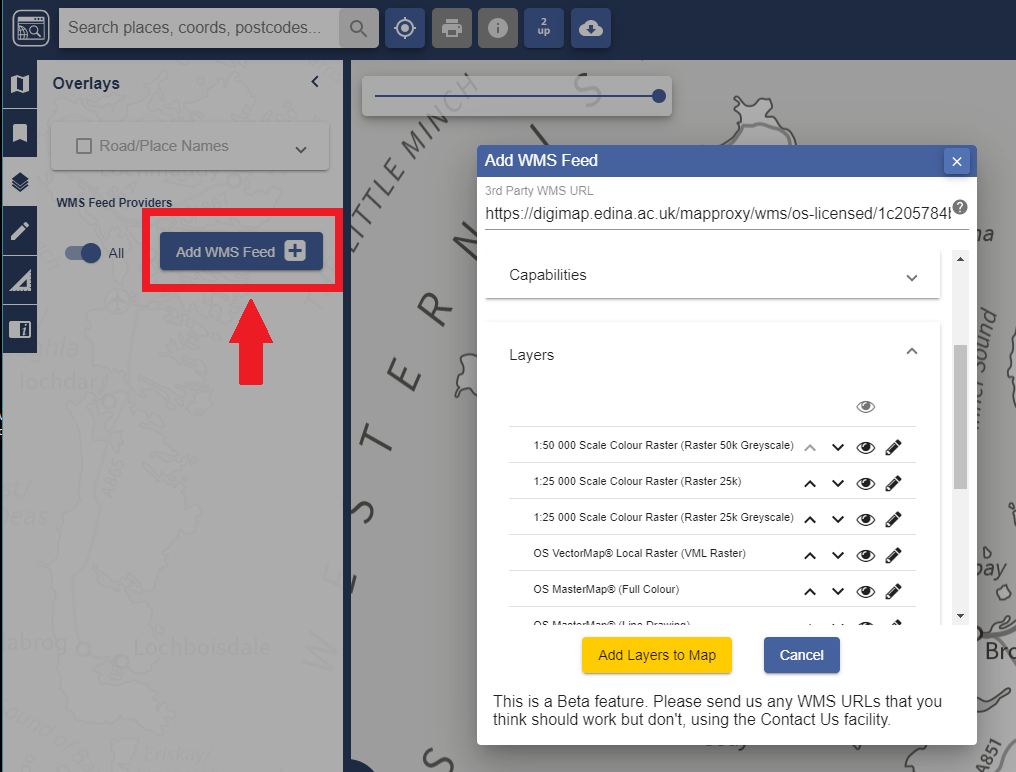
A significant new feature is the delivery of WMS (Web Map Service) feeds for all the maps appearing in Digimap’s Roam applications. A WMS feed allows you to stream any of the Roam maps directly in to GIS software (e.g. QGIS or ArcGIS) or another Roam application. Select your Collection and look for the Web Services box below Data Download. This is currently available in all Collections except Lidar, Global and Society.
You can paste the URLs given into the WMS Server Connection interface in your GIS or use the “Add WMS Feed” button in Roam. This will give you a window in which to paste the WMS URL:
Any institution subscribing to Digimap’s Ordnance Survey Collection can now take a free trial of the Ordnance Survey Northern Ireland (OSNI) data. The free trial lasts until 31st July 2019.
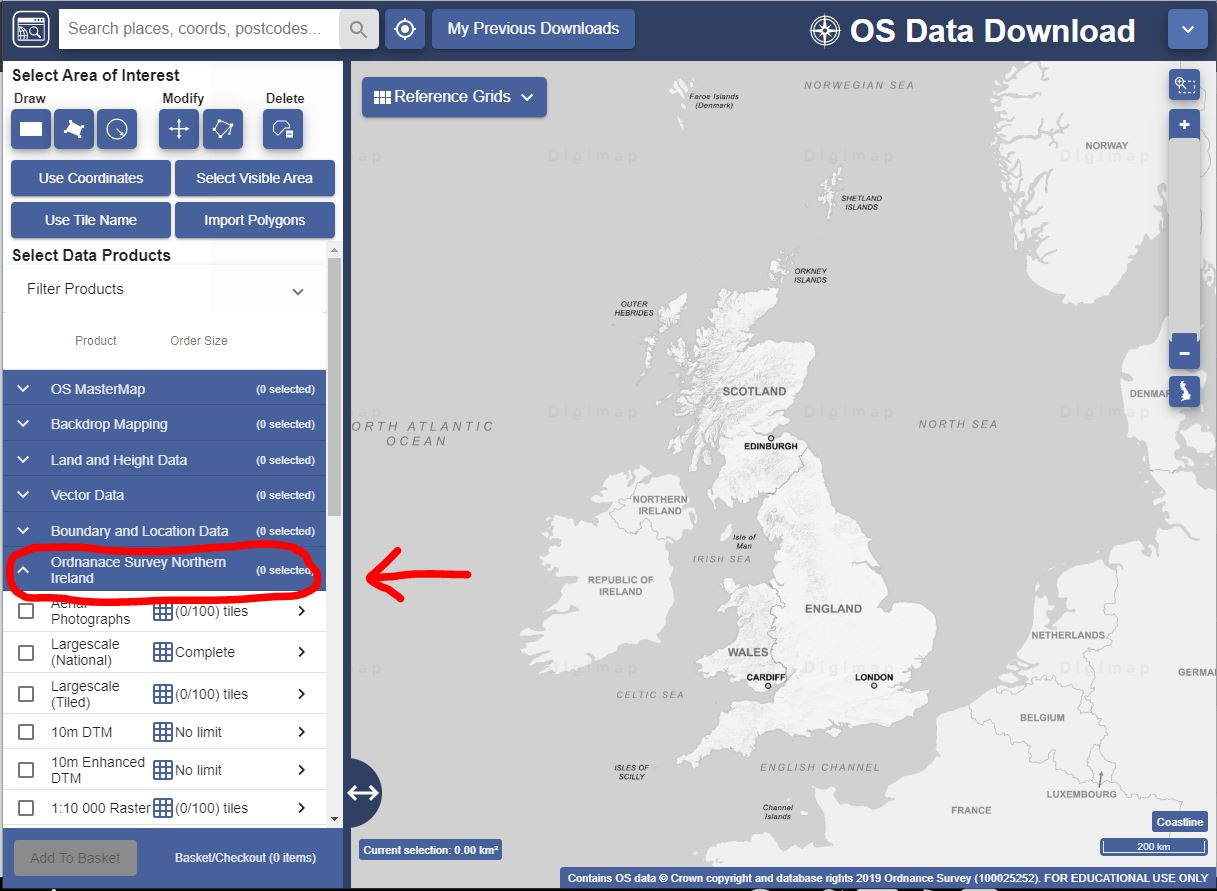
The OSNI data can be accessed within Digimap’s Ordnance Survey Collection. Log in to Digimap and choose Data Download from the OS Collection. You will see the OSNI heading in the list of available data on the left hand side:
OSNI data can be found in Data Download
A range of raster and vector data is available at scales ranging from 1:2500 to 1:1 million. Aerial photographs are also included. All OSNI data is currently available for download and will be added to Roam in due course.
To sign up to the free trial, please contact your Digimap site representative or EDINA to express your interest. The trial is free but requires a subscription process to be completed by an authorised person.
If you have any questions about the OSNI data, we’re happy to help. Please contact us on digimap@ed.ac.uk or 0131 650 3302.