Over the last month or so, following feedback from users of the Digimap service, we made a few additions and enhancements to Digimap. We will be running a webinar on these early in the new term but here is a quick run down of the new features:
- New Overlays added to OS Roam: Points of Interest (POI), Contours, Spot Heights and Postcode boundaries
- Ability to view attributes of the POI, Contours and Spot Heights Overlays using the Information Tool
- A5 printing in PDF, PNG and JPG now available in Roam
- Ability to view attributes for imported data
- Search results are now split into tabs
- Digimap data now available via Web Map Service (WMS) feeds allowing the data to be streamed directly in to GIS applications and other Digimap Collections
- Transparency slider added to all basemaps allowing you to fade out the basemap so that additional data stands out more clearly
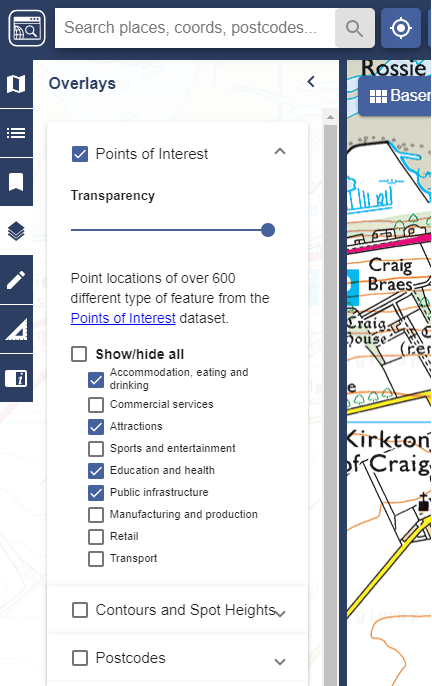
Overlays
All Overlays in OS Roam can be found in the Overlays panel on the left hand side. Each Overlay has independent settings which allow control of the transparency of the Overlay layer and the ability to control which elements of the Overlay dataset are visible (or not). When printing a map which contains customised overlays, the customisation will not appear on your printed map. This means that if you select only one POI category on the screen, all POI categories will appear on the printed map. This is something that will be improved in the future.
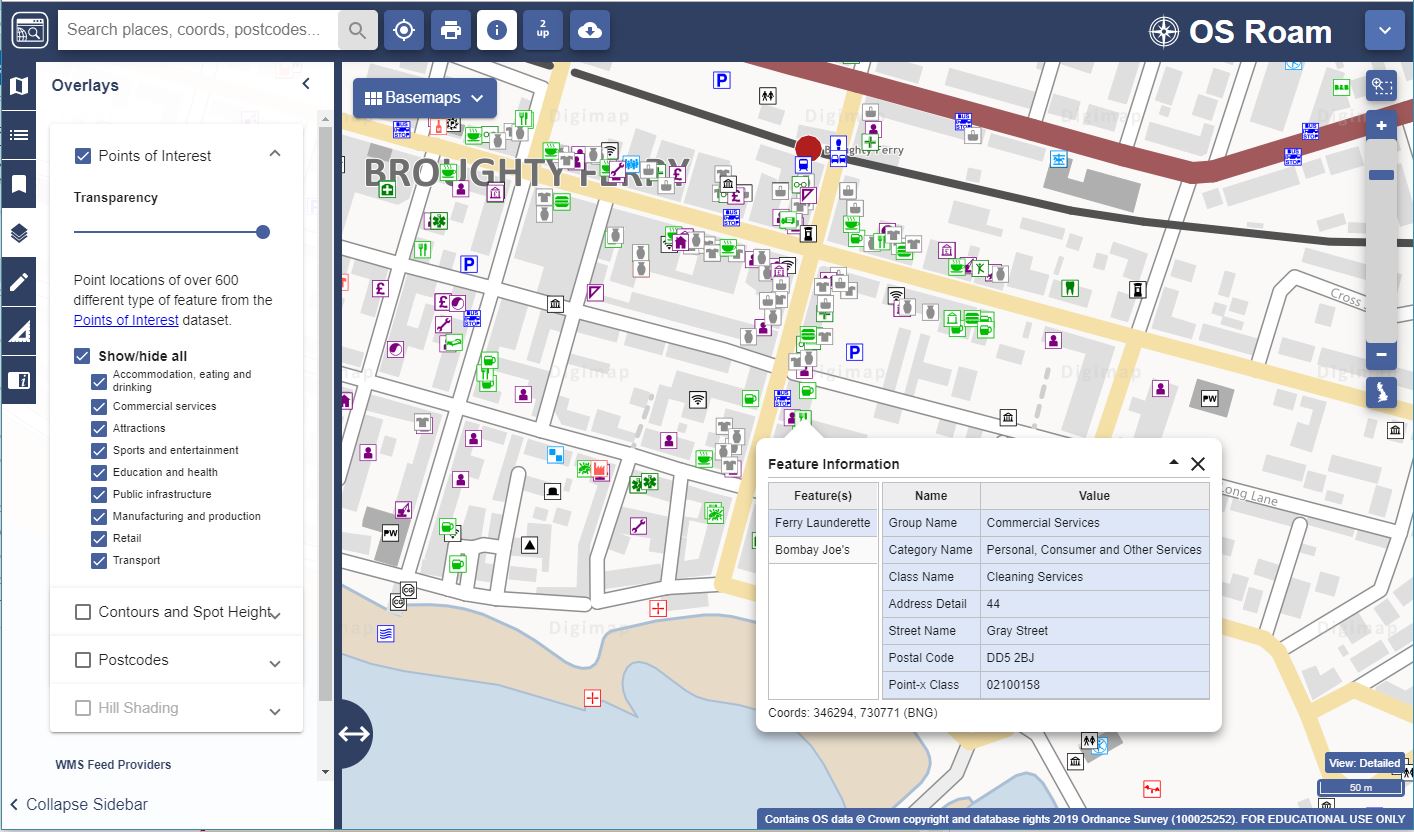
It is also possible to view the attributes of the new Overlays using the Information tool in the header bar of the main window. Clicking on an Overlay feature will display the attribute information available for the feature. This includes, in the POI dataset, what type of business is represented, the address and postcode as well as the business or feature’s name.
View attributes of uploaded data
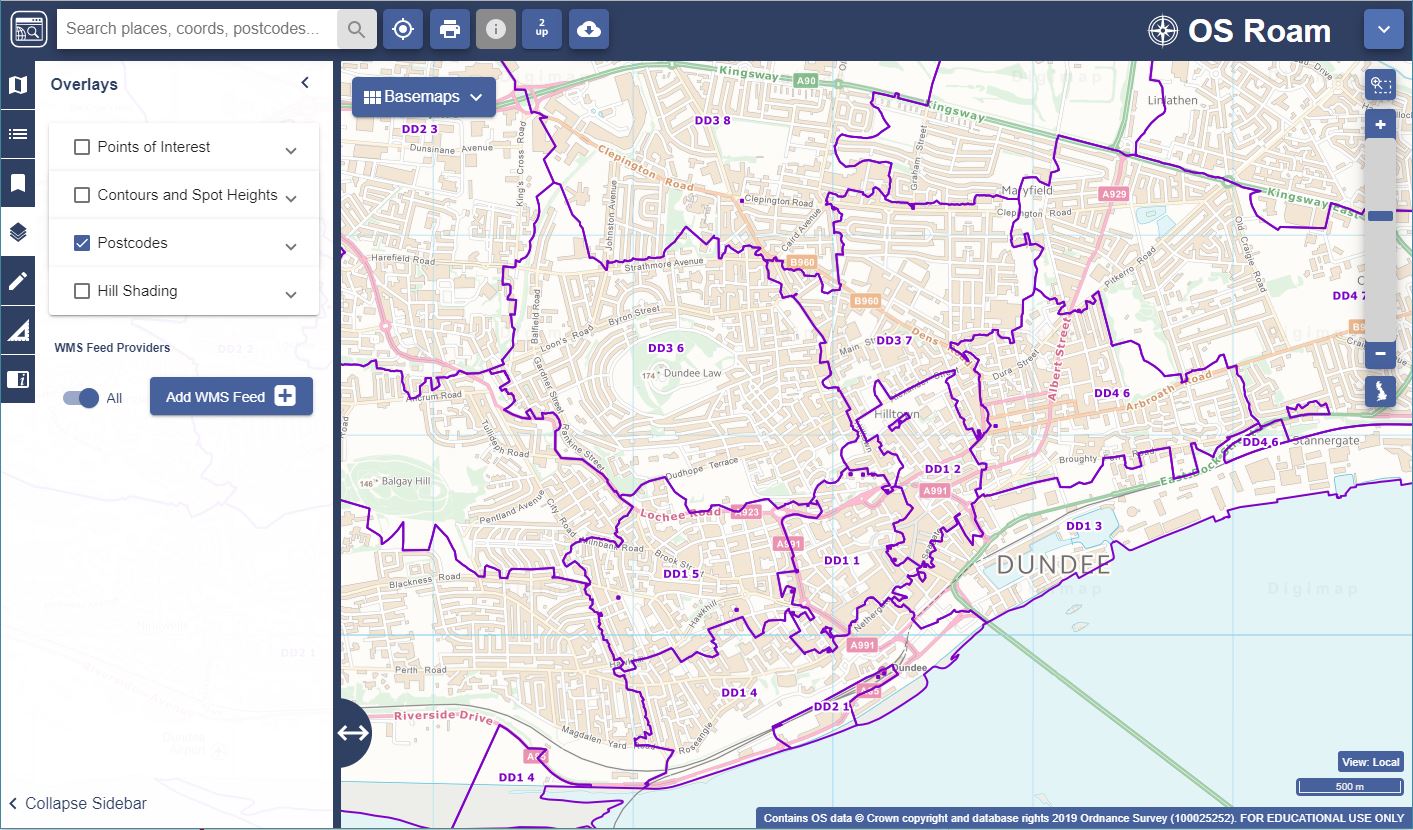
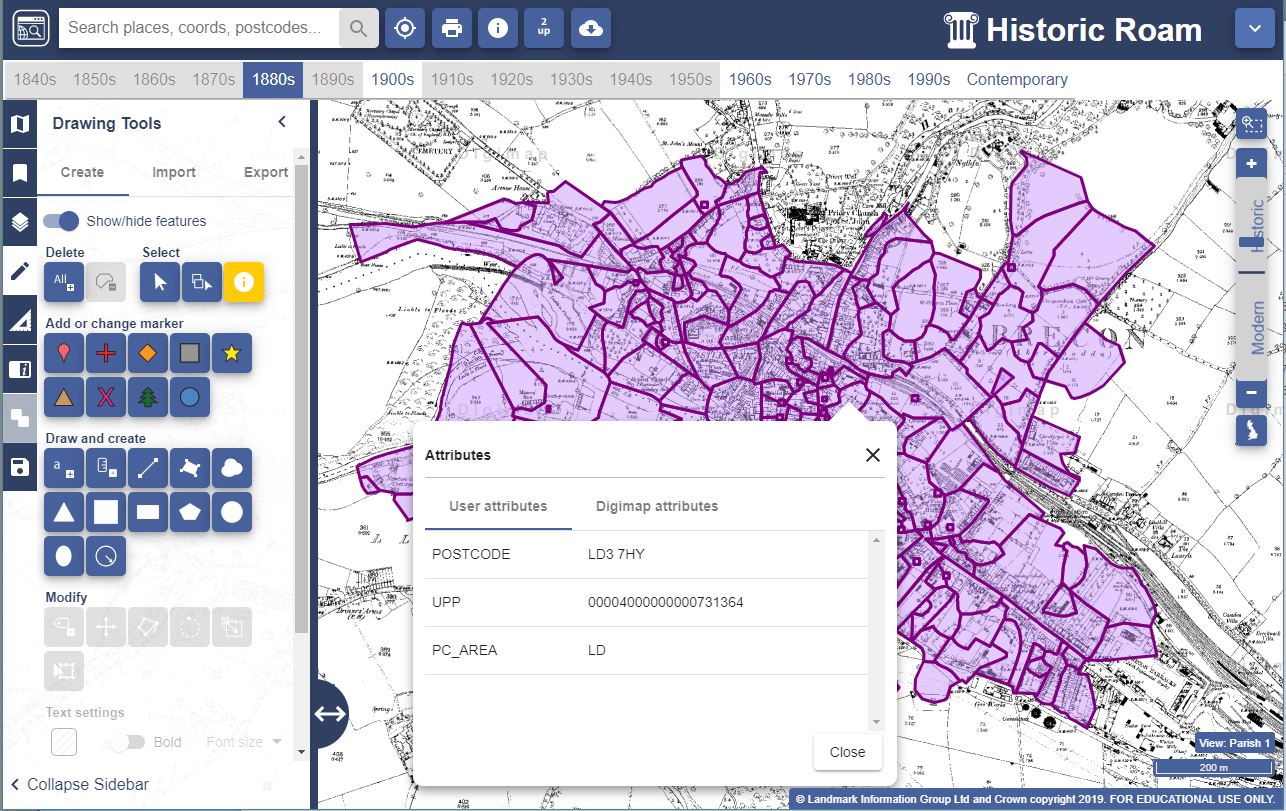
It is now possible to view the attributes of datasets loaded in to Roam. A variety of common spatial data formats, including Shapefile, GeoJSON and KML can be imported using the Drawing Tools > Import function. Once imported, attributes associated with each feature can be viewed using the Information tool. Below is an example of some imported postcode polygons with the Information tool identifying the postcode of the selected polygon.
Improved search results
We’ve made a small improvement to the way search results are displayed. When you search for a term, the results are now displayed in tabs according to the type of object you’ve searched for (Places, Roads, Postcodes and Grid References). This means that it’s much easier to find the result you want in a long list.

Digimap data now available as WMS feeds
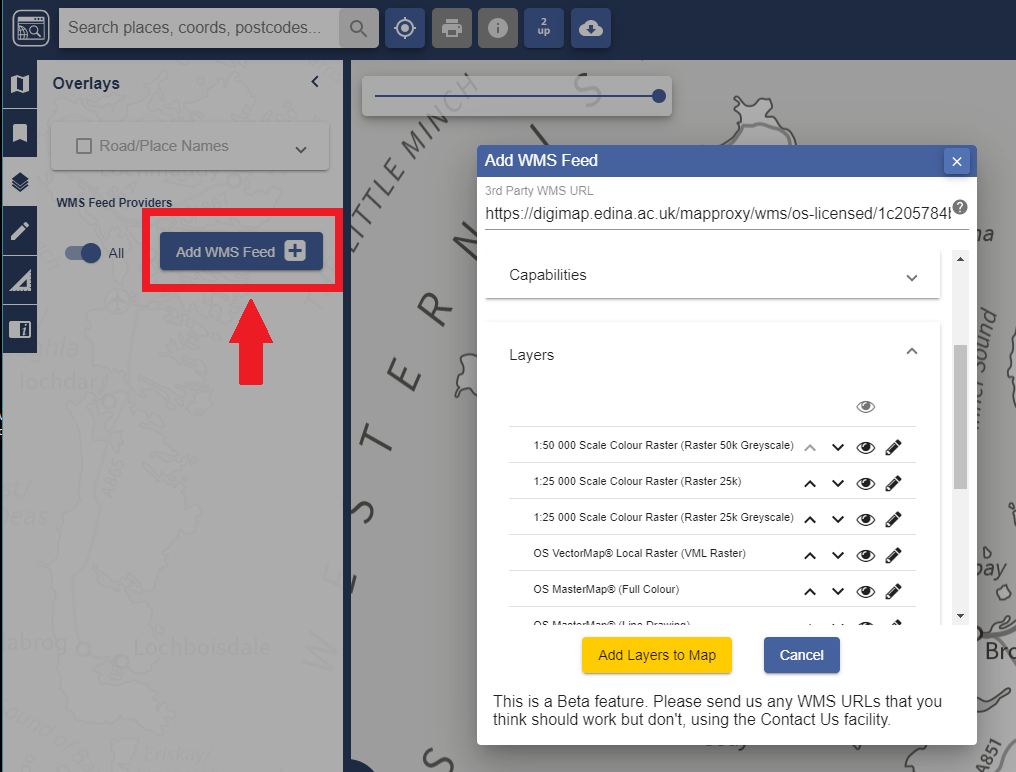
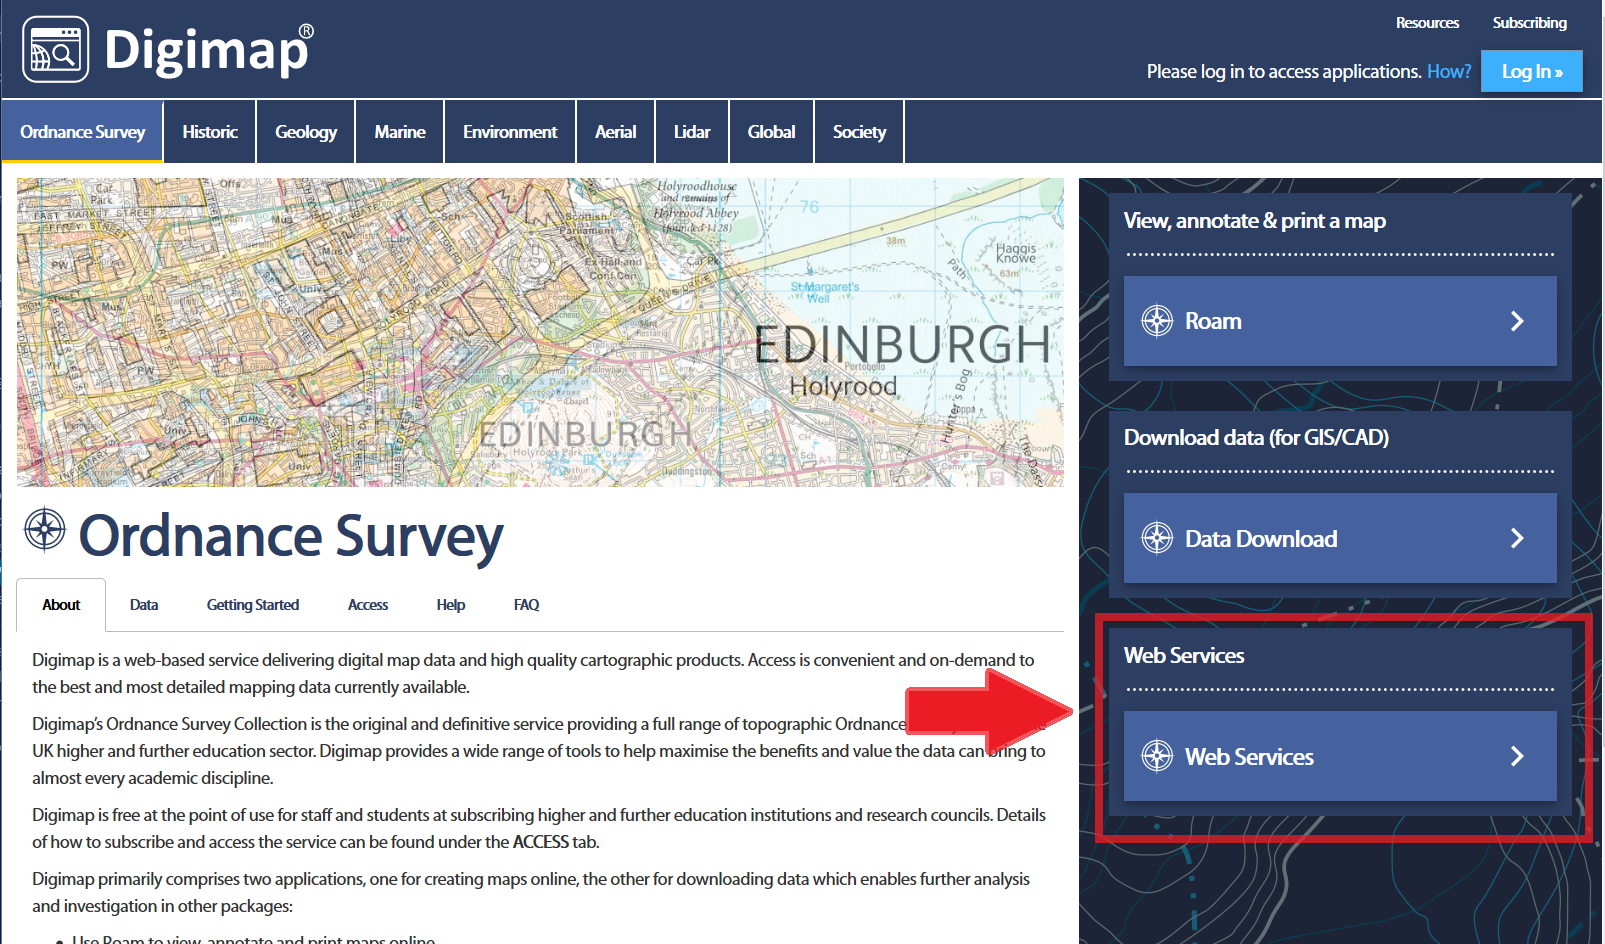
A significant new feature is the delivery of WMS (Web Map Service) feeds for all the maps appearing in Digimap’s Roam applications. A WMS feed allows you to stream any of the Roam maps directly in to GIS software (e.g. QGIS or ArcGIS) or another Roam application. Select your Collection and look for the Web Services box below Data Download. This is currently available in all Collections except Lidar, Global and Society.
You can paste the URLs given into the WMS Server Connection interface in your GIS or use the “Add WMS Feed” button in Roam. This will give you a window in which to paste the WMS URL: