This summer our cartographic team have been busy working on a new style for OS MasterMap Topography layer. These are the maps displayed at the three most detailed zoom levels in Digimap OS Roam. The original style, created more than ten years ago, followed the official style published by Ordnance Survey and has undergone little change since its creation. Later this year Ordnance Survey are making significant changes to the underlying MasterMap data so we thought it was high time the cartography was refreshed to give it a more modern feel.
The design brief had three broad requirements:
- make it look ‘nicer’!
- tone down the colours to allow annotations to stand out more
- use the same colours as OS VectorMap Local, the second most detailed data product
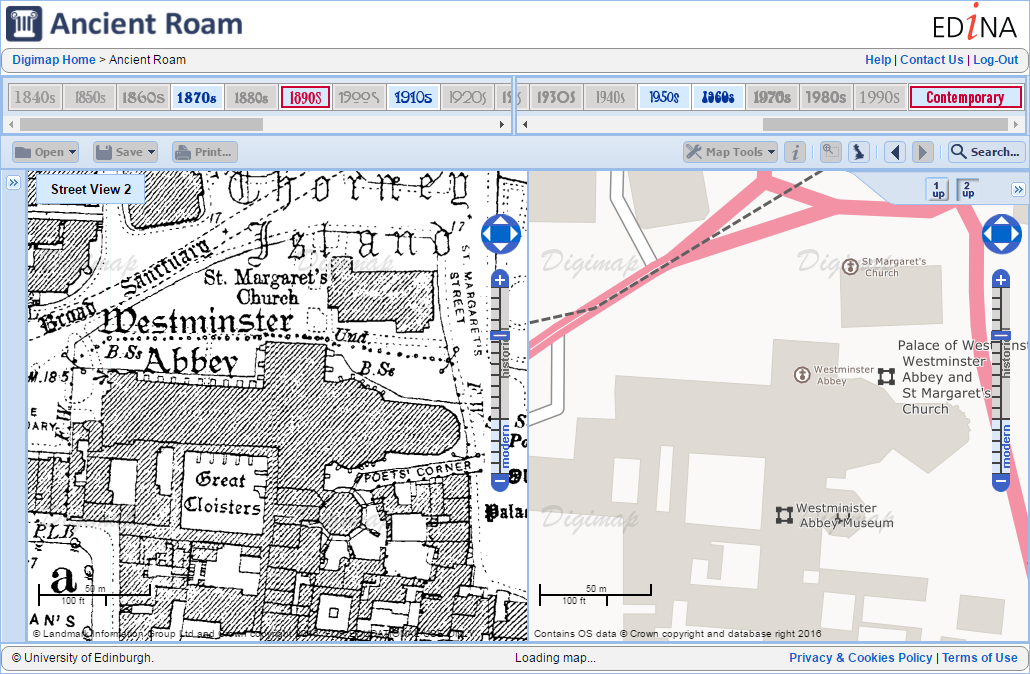
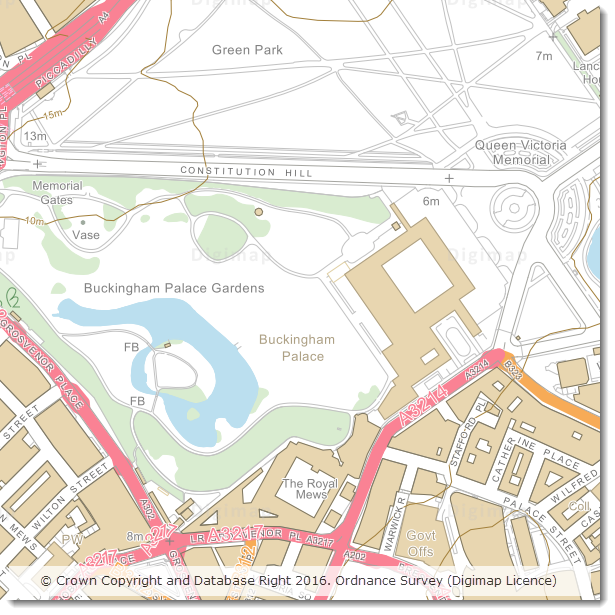
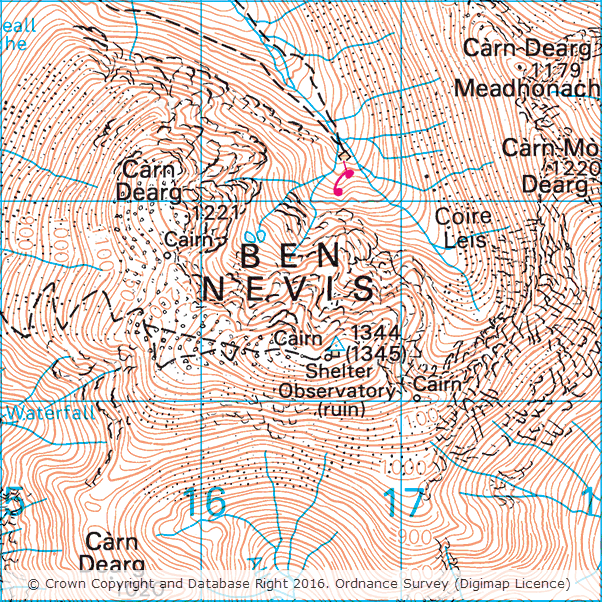
The images below show the original and new styling for a number of areas which highlight the improvements that have been made in both urban and rural areas.
Changes to styling in urban areas:
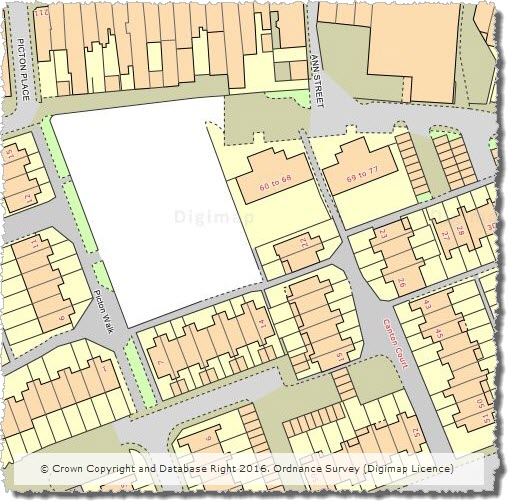
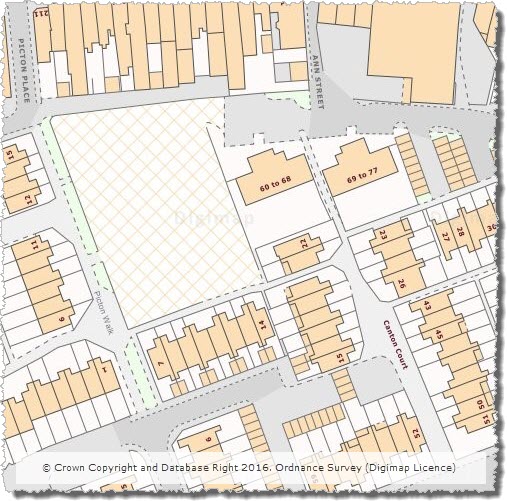
The colours in urban areas have been muted, removing the large areas of yellow and making ‘unclassified’ land appear with hatching rather than as blank areas on the map.
Improvements in text styling:
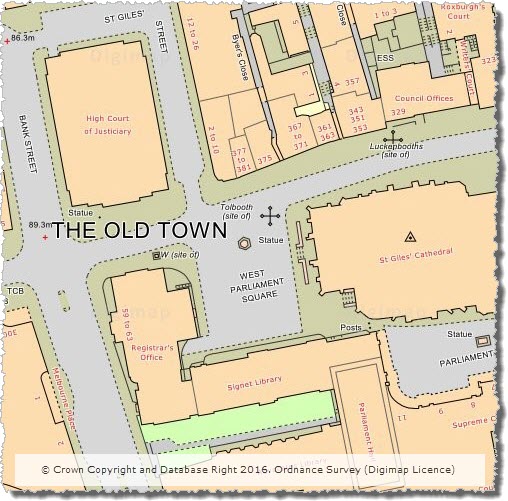
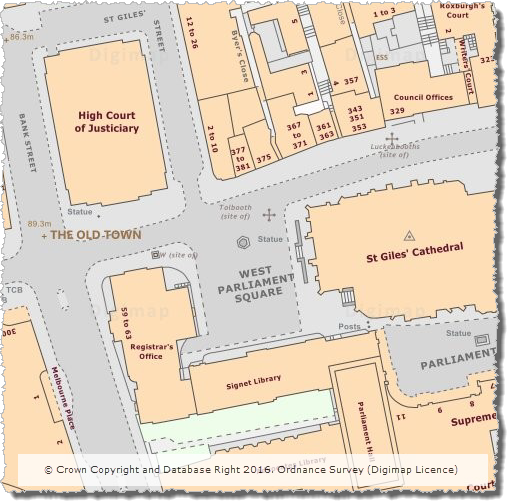
Text labels have been updated to emphasise building names and reduce the size of the labels for named urban areas.
Updated rural styling:
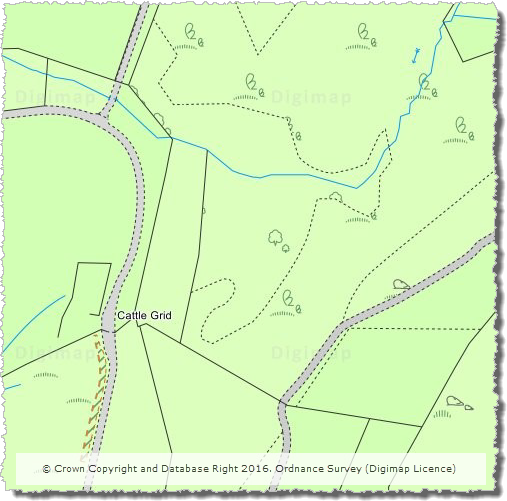
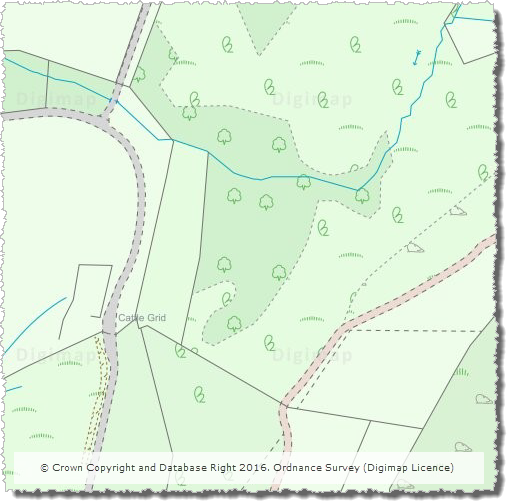
Styling in rural areas with mixed land use is a challenge as there are multiple types which need to be conveyed to the user. We have increased the number of shades of green and improved the symbol spacing and placement in order to improve the appearance of these areas. Additionally we have changed the fill colour for tracks allowing them to be more easily distinguished from paved roads.
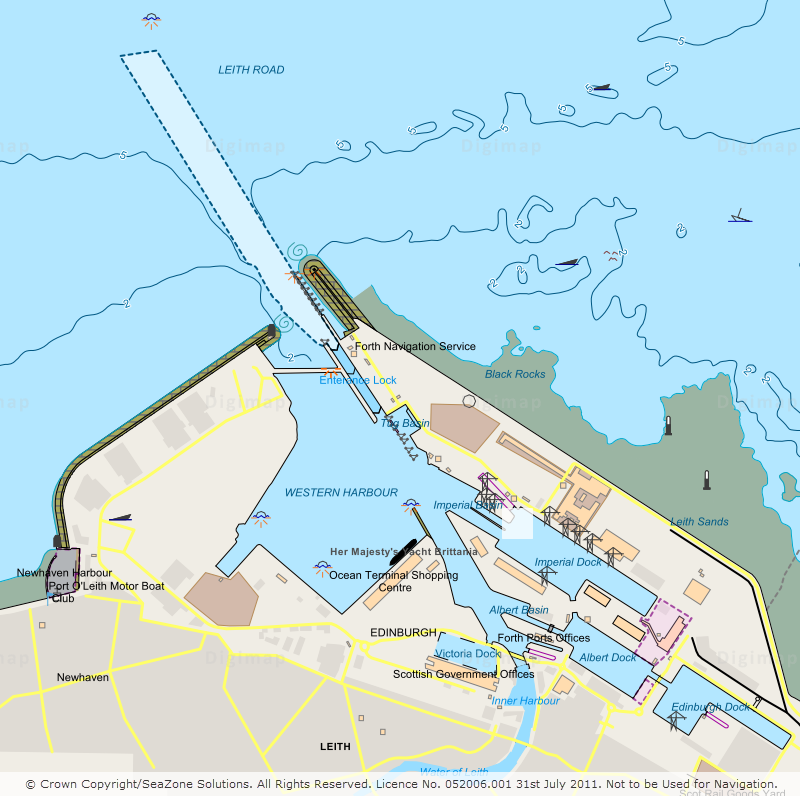
Updated foreshore styling:
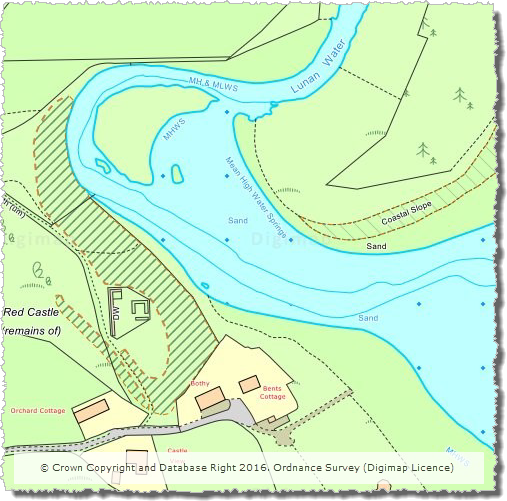
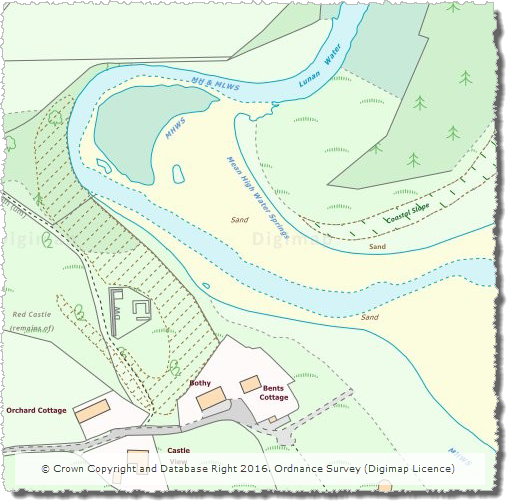
Foreshore areas now display using the yellow ‘sand’ colour, making them far easier to visualise.
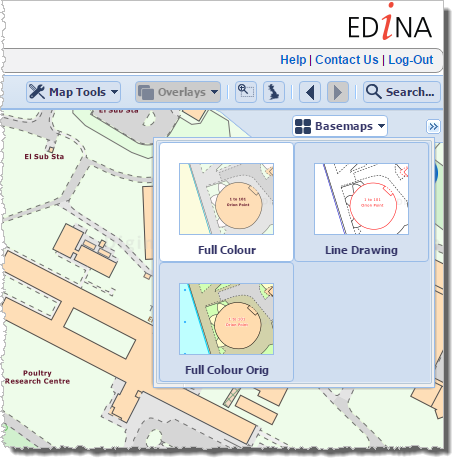
We hope you like the new style, however the original style can still be accessed from the Basemap menu in OS Roam:
If you have any questions about the updates or Digimap please contact us:
- Phone: 0131 650 3302
- Email: edina@ed.ac.uk