
COVID-19 and the Edinburgh congestion charge II
Local air pollution update (10 June 2020).
Summary
The declines in pollution levels, as caused by the downturn in vehicle emissions during the COVID-19 lockdown, provide clear and direct examples of what might be possible in ultra-low emission zones of the future.
Scottish network of continuous, ground-based monitoring sites
Local air pollution continues to be monitored at the Scottish network of continuous, ground-based monitoring sites despite all the difficulties that COVID-19 and the lockdown have brought. Results are provided due to the efforts of the engineering and environmental consultancy, Riccardo. Analyses and data are all readibly made available and accessible on the excellent “Air Quality in Scotland” website.
When preparing my previous post on COVID-19 and the Edinburgh congestion charge (2020/05/04) I was somewhat worried that I should have been making greater allowances for changes in the weather pre- and post-lockdown. However, a few quick backtrack calculations of the source of air masses arriving at St John’s in March and April had indicated it was unlikely to be of major concern. Somewhat to my relief Edinburgh St. John’s (see trend chart graph below) is continuing to show compelling evidence of a dramatic reduction in pollution levels following lockdown.
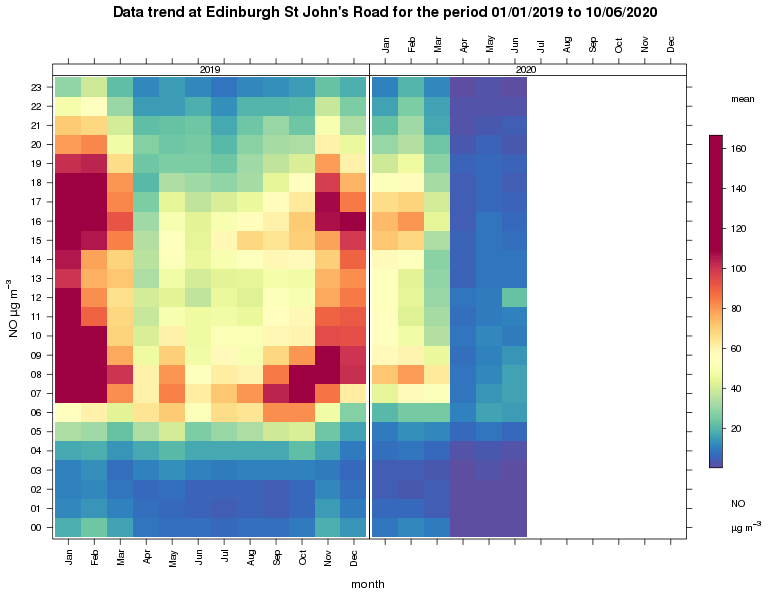
Nitrogen monoxide (NO). Monthly mean of hourly mean from January 2019 to 10 June 2020. Red shows hours and months with high pollution levels. Blue shows low levels. Thus the topmost lefhthand corner green square represents the monthly mean for NO as measured at 23:00 during January 2019. Note the sharp, dramatic change to predominantly blue colours, (final three columns) rather than yellows and reds, since end March (lockdown) 2020. the data used extends up to 10 June 2020. [NB. Recent measurements obtained from SAQN’s real-time analyser are provisional and do not yet have ‘ratified’ status. However, any retrospective correction to the archive dataset is only likely to result in minor rather than wholesale value changes.]
The above figure nicely confirms that the ‘lockdown’ change in pollutant concentrations is real and was not previously over emphaised. Differences between monthly means in 2020, post lockdown, and the equivalent 2019 mean values (as origainally noted in my previous blog for the month of April) can now be seen to have contined throughout May and up to the present day (10 June).
As a confirmatory second example the trend plot (below) for Dundee Seagate shows exactly the same effect. Note how the final three columns of 2020 are all deep blue (NO < 20 μg m-3) at all hours of the day. In this extended trend series it can be readily observed that no previous years, from 2006 onwards, show pollution levels anywhere close to being so low as in April/May/June 2020.
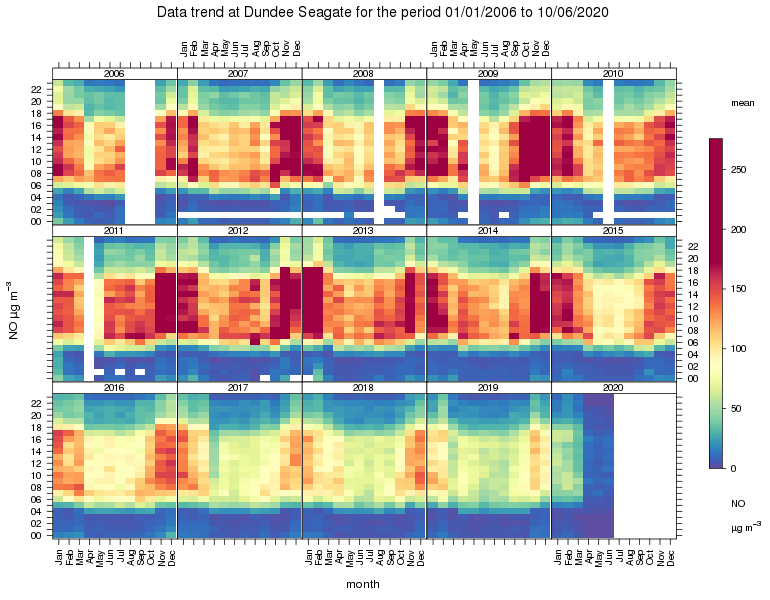
Dundee, Seagate. NO levels 2006 to present. Symbols and basic layout in Fig 1. However, note the different colour scales. The longterm downward trend can be attributed to the introduction of catalytic converters. However further reductions are likely to be limited as the catalytic technique is limited to petrol driven vehicles. Heavy vehicles (e.g. buses and trucks) and ever increasing traffic levels are likely to keep nitrogen oxides emissions high.
NO (nitrogen monoxide) shows the changes particularly well because it is the dominant nitogen oxide gas produced by the reaction of nitrogen and oxygen gases in air during high temperature combustion. NO2 and NOx are of more interst to regulators as they have more impact on humans and the environment. NO2 is partly produced directly from combustion but mainly from oxidation of NO. Exactly the same effects, as described above for NO, are found for NO2 and NOx at both the Edinburgh and Dundeed sites. Indeed dramatic drops in all nitrogen species are found at essentially all urban sites across Scotland.
A final pair of trend plots (below) shows the same Dundee Seagate NO data but this time plotted against wind speed and direction ather than hour of the day. Blank areas are missing data. Nevertheless the dramatic change at lockdown (final three deep blue columns) demonstrates how reduced lockdown traffic dominated over local meteorology.
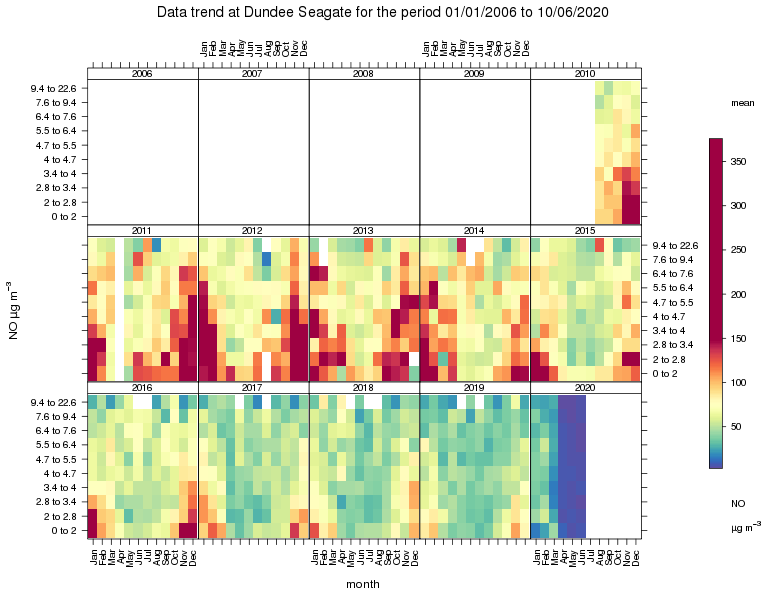
Dundee, Seagate. NO levels 2006 to present. Similar layout to Figs 1 and 2 but NO plotted against wind speed. White cells represent missing data. An overall longterm downward trend can again be seen. As can high NO concntrations (red and orange cells) at times of low wind speed conditions, especially in winter months. The dramatic change at lockdown is easily seen by the deep blue colour in Aril/May/June 2020.
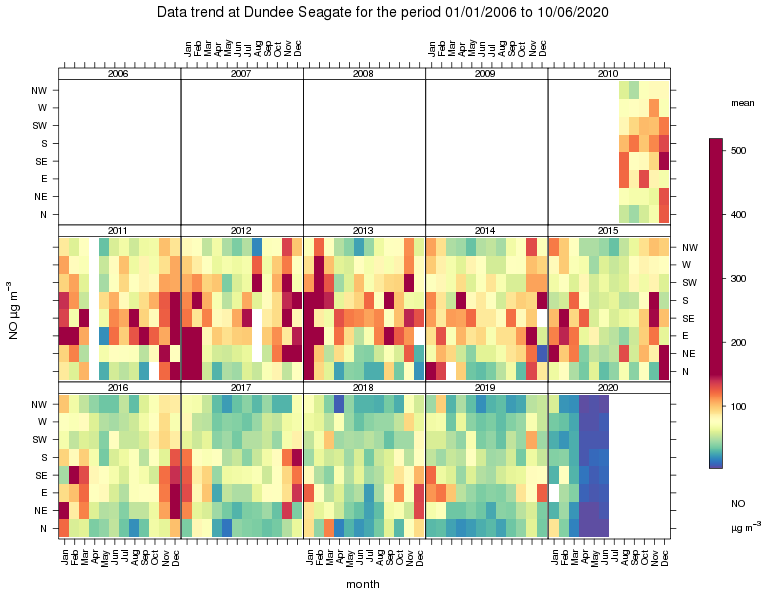
Dundee, Seagate. NO levels 2006 to present. Similar layout to Figs 1, 2 and 3, but NO plotted against wind direction. White cells represent missing data. An overall longterm downward trend can again be seen. As can high NO concntrations (red and orange cells) at times of southerly (S) and easterly (E) winds. The dramatic change at lockdown is again easily seen by the deep blue colour in Aril/May/June 2020. There is a slight suggestion that NO was higher during southerly and easterly to north easterly (NE) winds during lockdown (pale blues), but the dominant effect is from reduced traffic flow it cannot be attributed to exceptional weather conditions.
Ultra-low emission zones
The declines in pollution levels, as caused by the downturn in vehicle emissions, provide clear and direct examples of what might be possible in Scottish cities in the planned ultra-low emission zones of the future.
“Omission of air pollution from report on Covid-19 astonishing”
Finally, it is interesting to recognise that associations between COVID-19 and pollution levels work ‘both ways’ around. The normal association reported is how lockdown → less traffic → lower nitrogen emissions. interestingly another association (the opposite way around) is that high pollution areas → high COVID-19 fatality rates. Minorities in the UK and elsewhere are known to generally experience higher levels of air pollution, and there is growing evidence from around the world linking exposure to polluted air to increased coronavirus infections and deaths.


Recent comments