
Glimmer of hope XXIII
“I’ve seldom had so much fun reading about people dying.” The Times (June, 09, 2018)
Preamble
The catch-line is taken straight from a Times review, from almost exactly one year ago, of Laura Spinney’s magisterial account of the Spanish flu of 1918 and how it changed the world. Laura’s highly readable narrative (my current bedtime reading) begins with a map graphically showing the global spread of the Spanish flu: second wave, late 1918. Death tolls range from a tolerable 0.5% (New York City) and Odessa (1.2%) through to 9.9% (Ciskei, South Africa) and even to 40% (Bristol Bay, Alaska).
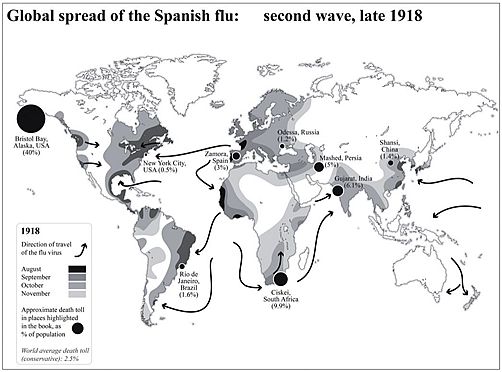
Map from Keerthik Sasidharan on Twitter.
The global reach of Laura’s map alongside her cover photograph (below) of the emergency hospital created to accommodate Spanish flu patients adroitly set the scene of her harrowing, and yet beautifully constructed, account. Her narrative of how the Spanish flu’s second wave was even more deadly than the first caused me to reflect on Professor Hugh Pennington’s (Scotland’s most renowned microbiologist) widely reported view that a devastating second peak of coronavirus cases this year is “very unlikely”. It made me wonder, can curve-fitting help us prepare better for either the immediate future or for further ahead?
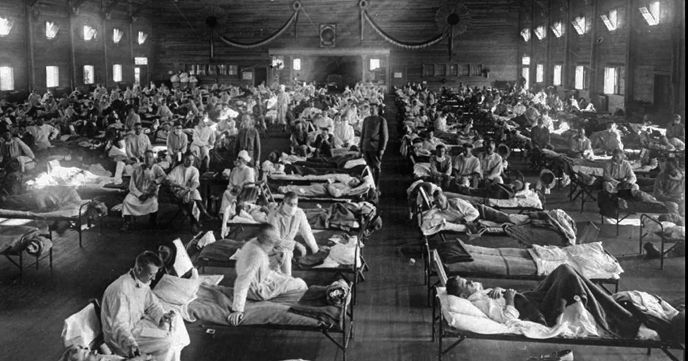
Soldiers ill with Spanish influenza at a hospital ward at Camp Funston, Kansas, when the epidemic began in 1918.
“More or Less”
The “More or Less” BBC Radio 4 programme about numbers and statistics, which often relate to topics in the news, has been asking for listeners’ suggestions. Here is mine (as e-mailed on 04 June).
Dear More or Less,
My suggestion of an interesting question to try to answer is: “When is the country expected to achieve herd immunity?”
Background
Awareness of herd immunity followed the notorious press briefing which featured the UK’s Chief Scientific and Medical Officers alongside Boris on March 12th. This was the point at which the country embarked on a markedly different approach to that of most European governments. As Rory Stewart quickly pointed out, the Westminster government was choosing a “very eccentric” tactic, of minimal intervention, which risked spreading the coronavirus to the rest of the world, while underestimating the impact of the virus on the NHS. At the press briefing it became apparent that relying on a herd-immunity policy would likely result in 80+% of the UK population rapidly becoming infected. (Herd immunity thresholds of other well-known infectious diseases transmitted by airborne droplet are of order 80%.) The resulting death toll was left to the audience to calculate and reflect upon. I have attempted a couple of back-of-the-envelope calculations to try to help understand when the UK can expect to achieve herd protection. Hopefully ‘More or Less’ researchers can greatly improve on my efforts.
Back-of-the-envelope calculations
My first back-of-the-envelope approach to estimating when the UK might achieve a significantly reduced risk of infection among susceptible individuals through an “indirect protection” or a “herd effect” uses UK mortality data. Method: multiply cumulative deaths by your favourite ‘fatality rate’ (e.g. 0.5% [1% is also a popular choice]), and voilà the ‘protection’ date is when projected deaths tot up to N * 0.80 * 0.005, where N is the total UK population (67,858,826 as of today, Wednesday June 3, 2020). 67,858,826 * 0.8 * 0.005 = 271 thousand deaths. I use King-Hubbert’s geo-statistical formula, first deployed for forecasting peak oil, to forecast COVID-19 deaths (https://blogs.ed.ac.uk/roythompson/2020/05/09/glimmer-of-hope-xix/ and graph 1b below). The UK is still a long way from a quarter of a million deaths.
I feel a much better estimate should be derivable from the ZOE citizen science study. The same geo-statistical curve-fitting formula can be applied but in this instance to the ZOE “symptomatic” data. Once again it is necessary to blend in two crucial numbers – the percentage of infections that proceed asymptomatically (e.g. 74% as determined by the Diamond Princess floating laboratory – sorry, cruise ship) and the average duration of symptomatics in the ZOE database. In the absence of better information about duration I adopt a value lifted from a Diamond Princess model-based analysis (Emery et. al., medRxiv, 2020) of 2.9 days [Much longer durations are also a popular choice].
I calculate cumulative protection by first hindcasting symptomatics all the way back to the UK’s very first COVID-19 index case (26/01/20), i.e. the date on which a female, who had entered the UK from Hubei three days earlier, developed symptoms of fever and malaise (Lillie et. al., J. Infection (2020) provide details of this initial index case). Secondly I integrate under my Hubbert curve as fitted to all the available ZOE symptomatics data (65 days’ worth). Thirdly I forecast symptomatics forwards (see graph 2 below). Adding all three together I arrive at 58.1 million case-days by mid-September. Dividing by 2.9 converts to cases (58.1 / 2.9 = 20 million cases). Lastly I multiply up (using the 74% statistic, in order to add in infections that proceeded asymptomatically 20 * 74 / (100-74) = 57 million = 85% of UK population) to arrive at the conclusion that the UK could be seeing herd immunity in the autumn.
However, are the key assumptions in these back-of-the-envelope calculation at all realistic? Also do I need to worry more about clustering (i.e. the K number and population heterogeneity)? Have I missed other vital complexities? Demography? Imperfect immunity? Evidence for the emergence of a more transmissible form of coronavirus, SARS-CoV-2?
I look forward to seeing how ‘More or Less’ go about deriving a more informed answer to the question posed at the outset: “When is the country expected to achieve herd immunity?”
Roy Thompson, FRSE, roy@ed.ac.uk Emeritus Prof., School of GeoSciences, Edinburgh University.
Figure 1
Figure 2
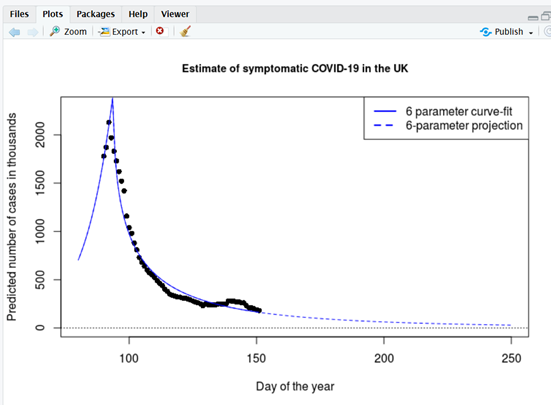
Symptomatic COVID-19. Maximum likelihood optimisation uses Hubbert’s formula to fit a sharp cusp shortly after lockdown. (Infections briefly continued to spread within households after lockdown, before the number of infections amongst the public at large dramatically collapsed). The minor upward kink at around day 140 is possibly due to ZOE’s artificial intelligence diagnostic not completely taking hay fever symptoms into account, but could be removed from the Hubbard projection if desired.
Regards
Prof. Roy Thompson, FRSE; School of GeoSciences; The University of Edinburgh, EH9 3FF
;;;;;;;;;;;;;;;;;;;;;;;;;;;;;;;;;;;;;;;;;;;;;;;;;;;;;;;;;;;;;;;;;;;;;;;;;;;;;;;;;;;;;;;;;;;;;;;;;;;;;;;;;;;;;;;;;;;;;;;;;;;;;;;;;;;;;;;;;;;;;;;;;;;;;;;;;;;;
Postscript
Since sending off my e-mail to the BBC it has been pointed out to me that a third dataset may be more useful still. The Office of Statistics (ONS) has begun releasing results from its Coronavirus Infection Survey Pilot. The ONS issues a bulletin which is lucid, transparent and, to my mind, almost ideal. All the output data is made readily available in machine readable form – excellent. All the graphs and all the key parameters are described clearly. It presents a pleasing contrast to my experience with the ZOE database. ZOE, of course, wins on sample size: 3.7 million citizen scientists, as compared to 20,207 people who agreed to an ONS swab test. (Set against the low numbers they represent a remarkably high percentage (96%) of eligible people in participating households.) But, because of the sampling design (randomised sampling drawn from a representative sample of the whole community population of England) the ONS swab results are more easily generaliseable and interpretable than ZOE’s. Concerning antibody tests, the ONS sample size of 885 is even smaller. Nevertheless the ONS concludes that only about 7% of the population (the 95% confidence interval runs from 5.2% to 8.6%) have so far been infected. In short the majority of the population are unlikely to have been infected. If so, and if in addition the infection rate is really going down, then the prospects for ‘herd immunity’ reaching 80% (or even 60%) this autumn are slim. A viable vaccine before Xmas also looks unlikely. Prepare for a long haul.


Recent comments