
3D plot of unusual microseismicity during reservoir stimulation at Preston New Road
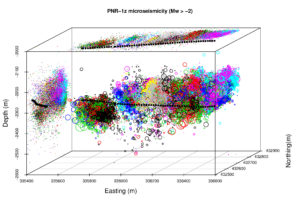
A 3D-view of the microseismicity generated during reservoir stimulation reveals an unusual spatial distribution.
The borehole, black squares, follows the usual geometry. The lateral dips gently down from its toe (far westernmost tip) having been drilled on-azimuth parallel to the presumed minimum horizontal stress direction. The cloud of 38,383 microseismic events detected by a well-distributed 3D-geophone array is shown by spheres. Each stage of fracking is colour coded. The radius of the spheres increases with event magnitude (Mw), up to the largest at 1.155. All events with magnitudes greater than -2 are plotted.
Events generally lie within a few hundred metres of the lateral. They closely follow the expected Gutenberg-Richter magnitude distribution. The vast majority are small. So far so good.
However, look at the projection of events (as small coloured dots) on the vertical plane – at the left-hand side of the 3D-box. The events are NOT centred about the lateral. Instead many lie well to the north. Also the earliest, three westernmost fracs (colour coded black, then red & green) tended to generate deep events, later fracs shallower events.
The sideways asymmetry is also conspicuous in the projection of events on the top-side of the 3D-box. In particular in the latter frac stages, as the heel of the well was approached (green, dark blue, cyan, purple clusters), the great majority of events were stimulated much further north than the borehole. Hardly any events were generated to its south.
Ideally the spread of events, at each frac stage, should have stretched out perpendicular to the lateral. The 3D-plot instead shows inclined and skewed microseismic groupings. An explanation could lie with the true horizontal stress direction being rather different from that expected, and with technical difficulties such as poor zonal isolation leading to leakage past the packer, or seal, separating stages.
While asymmetry is not unknown it is very unusual to be so strong. From a commercial point of view it is not desirable. It cannot be blamed away on the UK traffic light system, but more probably reflects greater geological, structural or pore-pressure complexity in the Bowland Shale formation than hoped for.
Data Source: PNR 1Z – Hydraulic Fracturing Operations Data as published under the OGA’s licensing regulations. https://www.ogauthority.co.uk/onshore/onshore-reports-and-data/preston-new-road-pnr-1z-hydraulic-fracturing-operations-data/
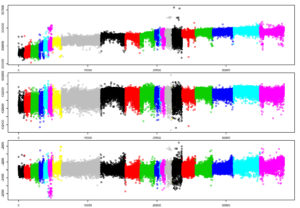 Raw data plotted in sequence order


Recent comments