
Curious spatial seismic discrepancy at Lancashire fracking site
Micro earthquakes produced by high pressure fracking at Preston New Road do not follow the expected distributional pattern. At first sight all looks to be business like. Cuadrilla’s hydro-fracking, at the end of 2018, generated a tight swarm of over 38,000 micro earthquakes at depths below 2km. Furthermore, the energy released neatly followed the anticipated geophysical pattern of the Gutenberg-Richter relationship.
So where is the problem? Careful examination reveals that at the far end of the well (at its western extreme) the quakes are mapped1 as occurring 150m too deep (Fig. 1, left-hand side at 335800m east). Most of the fractures produced nearer to the main borehole are, in contrast, typically 100m shallower than hoped for (see Fig. 1 at 336500m east). Moreover most of the fractures map at 150m further north than expected (Fig. 2). Ideally the swarm should be a single, diffuse grouping in the rock volume surrounding the treatment well. Such a pattern exposes the largest possible drainage area to the well bore. That is it enables efficient gas flow. A small number of quakes are also seen to lie in isolated clusters, possibility along pre-existing weaknesses (e.g. at coordinates 336500 & -2600 in Fig 1). In sum the fractures off to one side, at an unusual depth, or in isolated, outlying clusters are all undesirable.
How might the curiously mislocated arrangement of quakes of Figs 1 and 2 have arisen?
- One explanation could be incorrect geolocation. Quakes are physically pinpointed by monitoring the sound waves they generate. A model of how sound velocity changes with depth is applied when mathematically locating each individual rupture. An incorrect, or oversimplified, velocity model could have caused the mislocation.
- Alternatively the geology could be more complex than originally mapped. For instance a previously unsuspected westerly-dipping, brittle horizon could have been encountered. Or Cuadrilla’s optimal landing zone, for their horizontal well, may have encountered anomalously brittle and ductile layers.
- A third explanation could involve the local stress field. The deep geology at Preston New Road might be structurally more complicated than foreseen. Significant stress variations, perhaps associated with the numerous deep faults in the vicinity, could have induced skewed fracking. By, for example, focusing the energy sideways due to pressure transmission along the faults. Asymmetric growth of fractures around the treatment well (e.g. northward offset in Fig.2) can also be explained by a pore pressure gradient. If UK stress fields turn out to be spatially more variable than normally encountered then UK shale plays, which already face more geological, environmental and geotechnical difficulties than their US counterparts, begin to look commercially very unattractive.
In brief, Cuadrilla (19 June 2019) claim the Bowland shales at Preston New Road have “good reservoir and completion properties”. However they have yet to comment on their misplaced quakes. It will be interesting to see if they can produce a satisfactory explanation, especially if similarly curious locations are produced during the forthcoming second phase of high volume hydrofracking at Preston New Road.
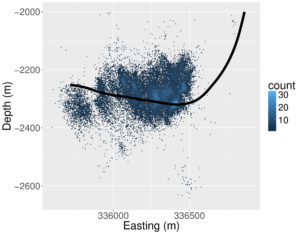
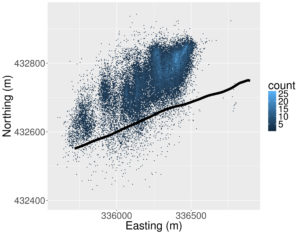
Figs 1 and 2. Locations of quakes projected onto E-W vertical-section and plan-view. Solid line shows trace of well.
1Microseismic event location. Because of the extremely small size of the micro-earthquakes produced by hydraulic fracturing an extensive geophone array is required. The set-up used by Cuadrilla appears to have been well thought out, with a good network of surface sites coupled with the nearby deep geophone string. A similar arrangement, deployed by PGNiG in a northern Poland shale play, located events to within a few tens of meters. To correctly interpret microseismicity it is vital to understand location accuracy. It would be helpful if Cuadrilla could provide information about the shape and size of their confidence ellipses. Specifically, a comparison of estimated uncertainty with the difference between perforation shot location and true position would neatly clarify the magnitude of the location errors.


Recent comments