Any views expressed within media held on this service are those of the contributors, should not be taken as approved or endorsed by the University, and do not necessarily reflect the views of the University in respect of any particular issue.
Digimap is an online map and data delivery service, available by subscription to UK Higher and Further Education establishments. Operated by EDINA at the University of Edinburgh, Digimap offers a number of data collections, including Ordnance Survey, historical, geological, aerial photography, LiDAR, marine maps, land cover mapping, global mapping and census data. For more information about Digimap go to our website: https://digimap.edina.ac.uk Background image Contains OS data (c) Crown Copyright and database right 2022
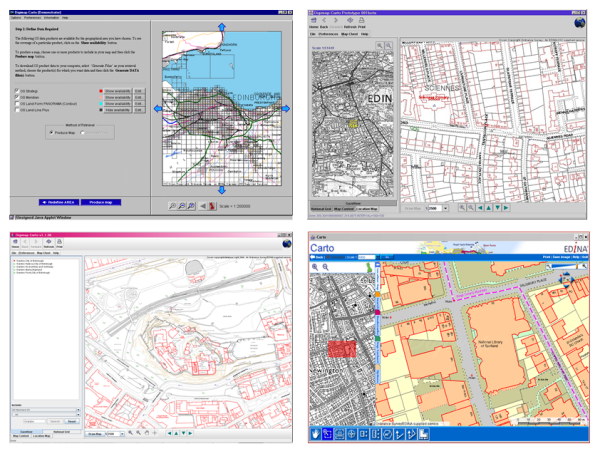
At 11:00 am access to Digimap Carto will be closed and by 12:00 noon it will have made its last map. Carto was at the cutting edge of web mapping technology for several years, delivering Ordnance Survey maps to thousands of users while Google was still just a search engine. The high quality EPS and then PDF print files it produced meant that staff, students and researchers could print out maps of anywhere in Great Britain and were no longer limited to their library’s collection.
Carto over the years 1998 to 2013
As time passed Carto could easily keep up with the latest offerings from MultiMap (later bought by Microsoft and eventually becoming Bing Maps) and Google Maps. It had more advanced tools and much better data in the form of OS MasterMap, so as the Java updates got more frequent we all put up with the software being a bit unreliable for a few days before we could issue a fix. However after 2011 the number of Java updates ramped up significantly and the changes became more difficult to accommodate. Once anti-virus software began seeing Carto as a potential threat and preventing it operating we decided that maintenance was unsustainable.
EDINA realised that continuing to support Carto would be too costly in terms of developer time spent fixing problems rather than improving and enhancing the service. In the meantime the rest of the world had become much more accustomed to viewing maps online in a web browser; EDINA’s other mapping service, Roam was able to take on much of what Carto was offering without confusing or frustrating its users.
Some recent changes to the capabilities of the web mapping platform that Roam uses meant that we could finally offer a Carto replacement without the need for any software to run on the end user’s computer. These changes have allowed us to withdraw Carto and let Roam to take on all the mapping duties for Digimap. We can now get on with the business of all those improvements and enhancements we have been wanting to make. We hope you will like the changes that we are aiming to have in place this August:
Geoforum aims to bring together staff who support the use of Digimap and other geoservices from subscribing institutions around the country and showcase what’s new and upcoming from EDINA. It also gives people an opportunity to ask the Digimap team questions and to chat with others about how support and promote geoservices.
There was a live blog running throughout the day which is still available for you to read and find out what happened.
Keynote Address
The keynote was delivered by Shelley Mosco of The University of Greenwich and was titled: Digimap Data and a non-traditionalist approach. Shelley is a member of the The School of Architecture, Design and Construction and described the ways in which spatial data could be used to inform design. Shelley was keen to stress the importance of spatial data and GIS in the implementation of Building Information Models (BIMs). BIMs have been used in large engineering projects for some time, however the government is making them mandatory for all publicly funded building projects in England and Wales. This means that commercial organisations will be looking for students to have been trained in the concept of BIMs and the software that drives them. You can find out more about BIMs through the following links:
BIM Task Group – government site promoting best practise for BIM
COBie – Construction Operations Building Information Exchange
Two of Shelley’s current MSc students also gave brief overviews of their experiences of learning about GIS and using spatial data in their projects. Both David Parfitt and Robert Park were self-confessed GIS newbies, but they managed to get data from Digimap and use it in their conservation projects. The data allowed them to visualise and analyse the environment and provide evidence to support their proposed designs. Their demo’s were excellent a they really showed the power of simple GIS analysis.
You can view the slides from this presentation here:
After the Keynote was a presentation that focused on Open or “Free” resources for geospatial teaching and research. The presentation looked at software, web-mapping and data. The main resources are listed below:
Data
OS Open data is available through the Digimap Data Download service.
ShareGeo Open is a repository for open geospatial data. It has lots of useful and interesting datasets on a variety of subjects such as wind farms, crime, boundaries and DTMs
QGIS – one of the best open source GIS out there. Lots of functionality and plugins that allow you to perform complex spatial analysis. It is also well supported by forums.
GRASS – a remote sensing package aimed at serious remote sensor’s. If you are a newbie to remote sensing, you can access GRASS tool through the GRASS plugin for QGIS which makes things really simple.
Web-mapping
Digimap is a great web mapping tool, but how can you create your own interactive web map for your website?
MapBox – simple intuitive web site that helps users build interactive web maps. Basic functionality is free, more advanced functions are available for a small fee.
Leaflet – the engine behind MapBox, it is free but requires user to do a “bit” of programing
Openlayers – an alternative to Leaflet which is more flexible. Openlayers powers Digimap. Requires a fair amount of programming knowledge.
MapServer – implements Openlayers for enterprise scale operations. MapServer is also used for Digimap services.
You can view the slides from this presentation on slideshare here:
After lunch the lead of EDINA’s geoservices Support team, Emma Diffley, shared what we have been busy working on.
Interfaces
Digimap is being streamlined, each collection will eventually have just a Roam and a Download. These interfaces will all look and work in a very similar way. The aim is to make the service more consistent and easier to use, but also much easier to maintain.
EDINA will be withdrawing Digimap Carto on 31st July 2013. Carto, launched in 1996, is harder and harder to maintain, so we have taken the best bits and put them into Roam.
On top of the Carto functionality already added to Roam the following improvements are coming soon:
an improved way of saving and opening maps and annotations
a Basemaps button to change the style or even mapping product you are viewing at each scale
The Download interfaces will also going through a similar process.
Data
A single consistent style for all the vector products through all the scale levels accessible through using the basemaps button in the new Roam.
VectorMap Local (VML) in shapefile and DWG formats
ArcGIS layer files for symbolising VML shapefiles coming soon
OS MasterMap Topo available as DWG is being planned
Support
There is a new Resource Centre, which does not require login, with answers to questions, videos, case studies etc.
Beyond Digimap
GoGeo has added more resources and now highlights the “Editor’s Picks”
ShareGeoOpen now has over 210 resources all of which are open and free to use
FieldTrip GB is a mobile app for capturing data, see below
GeoTagger – a tool to allow you to edit the metadata for your photos
Cartogrammar – upload your data and visualise it in different ways
UKBORDERS is now the UK Data Service Census Support Unit
On the horizon
We are still awaiting news on funding, but are lots of things we would like to do. Currently our focus is to “mobilise” more services and we will be continuing to add new support materials once the latest round of Roam and Download changes have been made.
If there are things you would like us to do we really want to hear about them. Recommendations from the user community carry real weight for us, and we are keen to hear ideas on new data or services we should be providing.
You can view the slides from this presentation here:
The final part of the day was about EDINA’s new mobile app for carrying out field work Fieldtrip GB. It simplifies the process of capturing data in the field against quality cartographic mapping. It is equally at home in urban environments as it is in rural ones. Custom forms allow users to design their own data capture projects and collect exactly what they need for their research. The session gave a brief overview before running a “live” group data collection exercise. A custom form was created and deployed to participants mobile phones. They then headed outside and captured data on things like building fabric and design. After 15 mins everyone reconvened and the collected data was “synced” and exported to Google Earth.
You can view the slides from this presentation on slideshare here:
As mentioned earlier, there is a transcript of the whole day in the form of a live blog so if you didn’t manage to attend and want to find out what happened please have a look.
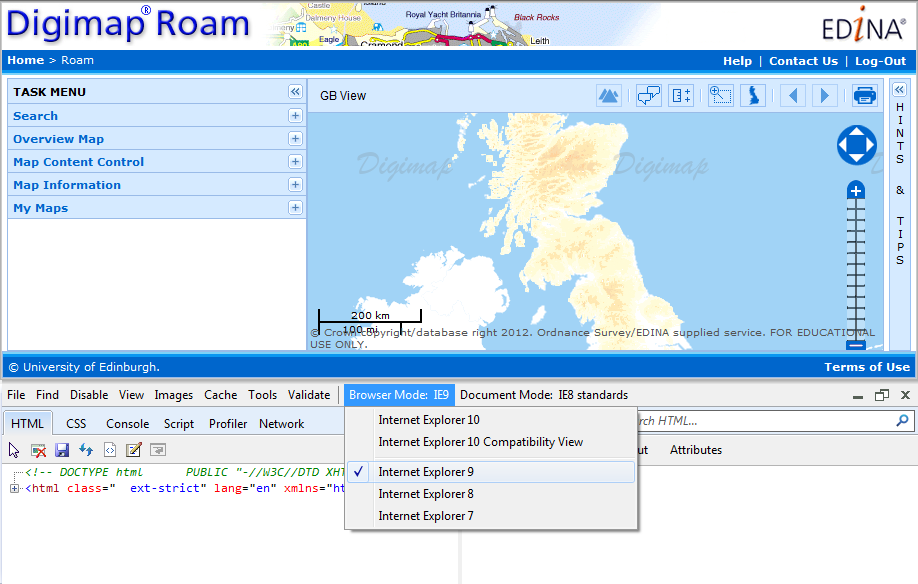
For those of you using Internet Explorer (IE) version 10, you may have noticed that the maps in Roam can get muddled up. This browser is standard for Windows 8 and is also available as an upgrade if you are using Windows 7.
The error is caused by the underlying technology EDINA uses to put the maps into your web browser. A patch for the particular piece of software that causes the issue has been released and we are now working to incorporate this into Roam.
Until this fix has been released you can prevent the error from occurring by switching IE 10 to run in IE 9 mode. To do this simply press F12 on your keyboard when you are using IE 10 and change the Browser Mode: to Internet Explorer 9. The image below shows how this is done:
Click the image to enlarge it.
This issue affects all the different Roam mappers, Digimap, Ancient, Geology and Marine, however all will be fixed by making the change to the browser mode.
If you have any questions about this or any other issue with the Digimap services then please get in touch:
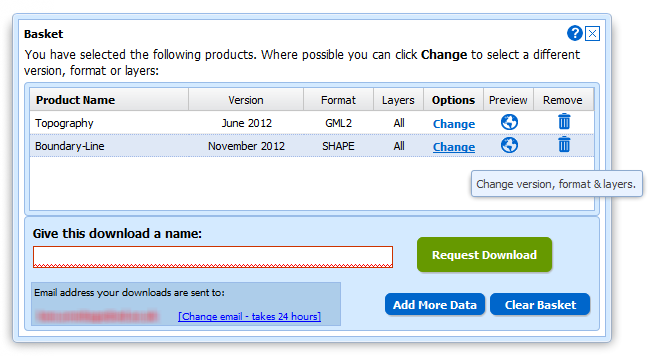
In January 2013 the OS MasterMap®, Boundary-Line™ and Code-Point® data products will be available from the Data Download service. We have tried to keep the changes necessary to accommodate these products to a minimum as the current interface has proved so successful (190,000 map tiles and files downloaded Nov 2012).
Here is a list of the changes and additions you will see in the interface; please note that they may still be subject to some change prior to launch.
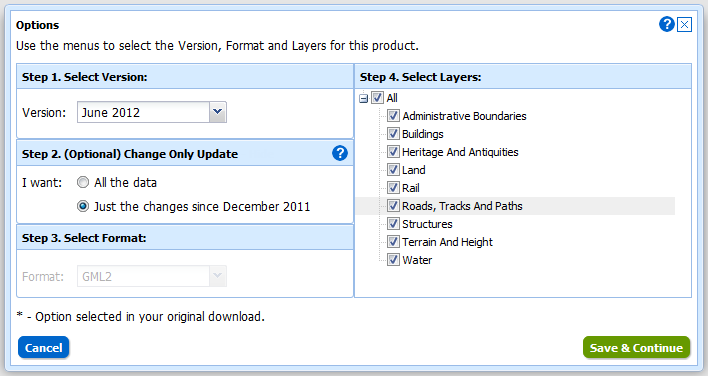
Both Boundary-Line and MasterMap have layers so we have had to make changes to the basket:
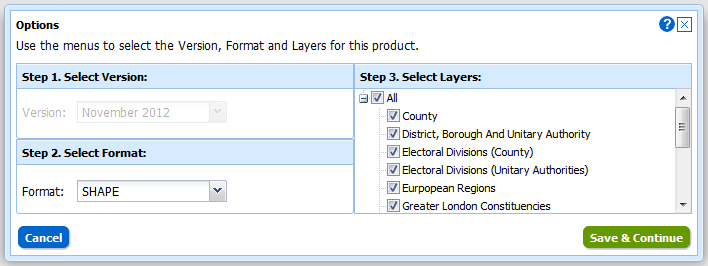
Instead of selecting Version and Format using drop-down menus there is a new pop-up for changing both these and the layers for each of the products in your basket. You can access this pop-up by clicking on the Change link in the Options column:
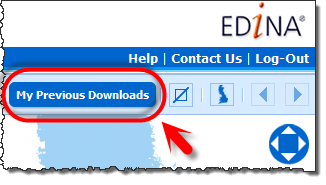
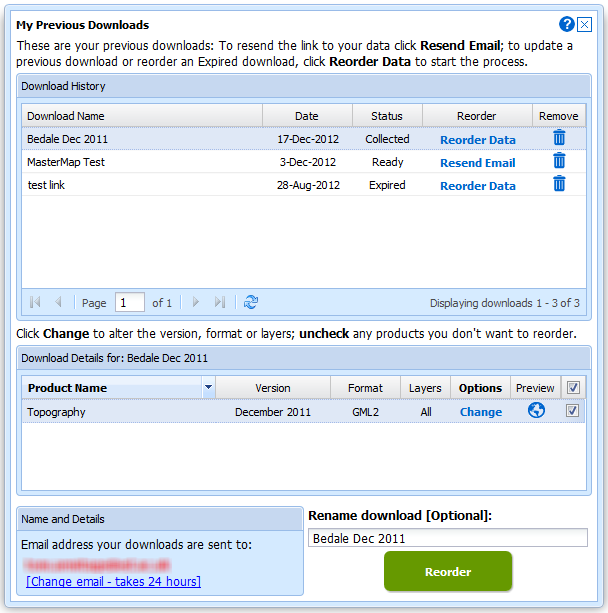
We have also improved the “My Account” section which is now called “My Previous Downloads”:
Once in the interface you can access any of your past downloads and reopen them at the basket stage:
It is now much easier to update your previous downloads to the latest version, get the same data in a different format or simply reorder data you have previously taken. In addition to these functions we have incorporated the ability to make Change-Only-Updates (COUs) to MasterMap Data:
Both Boundary Download and MasterMap Download will be kept in service for a transition period but as there are so many benefits to using Data Download we hope everyone will make the switch quickly. We expect to have switched off these services by the end of April.
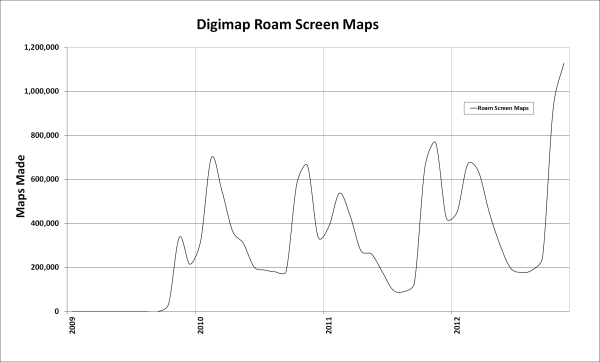
November was a record month for the Digimap Service with over 2 million screen maps made by the four collections. Digimap Roam made over 1 million screen maps alone and also broke its record for the number of print maps generated, over 28,000.
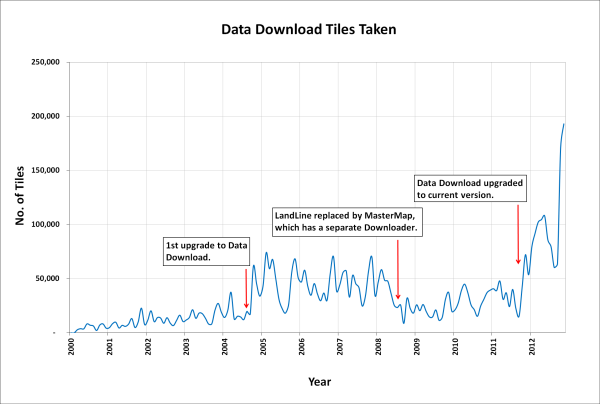
The number of files downloaded was also a record for Digimap with nearly 250,000 map tiles or files taken from the four collections. The Data Download facility for the Ordnance Survey Collection provided the bulk of these, over 190,000. Since the introduction of the new Data Download there has been a great deal more data supplied to staff and students but October and November have seen a huge spike. This has also been achieved from a lower total number of orders showing how the changes made in the upgrade have greatly improved the efficiency of the process. It is now much easier to get all the data you need in a smaller number of orders.
On top of the downloads from the Digimap Collections, ShareGeo Open also had a record month. ShareGeo Open is a repository for open spatial data that promotes the sharing and re-use of spatial data in teaching and learning.
There were over 3400 downloads of datasets from the service, nearly double last November’s total. There are almost 200 different datasets available from the service, with the recent addition of wind farm locations for the UK proving popular. The most downloaded dataset for the past 6 months is the Postcode Areas file, made from the Code-Point Open data.
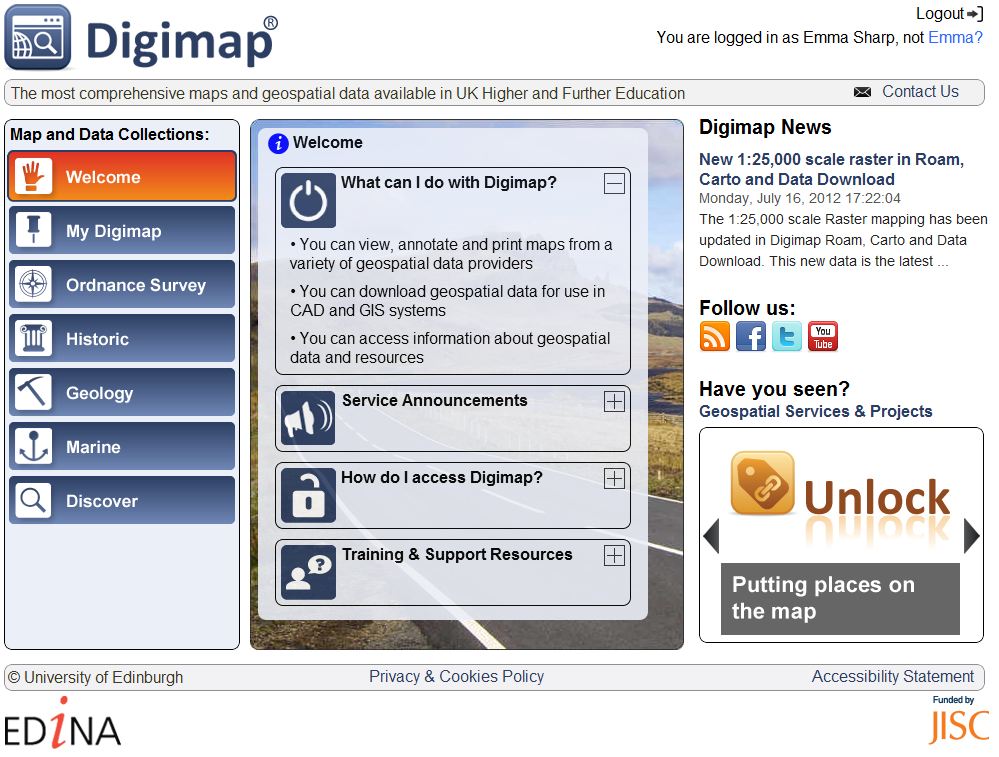
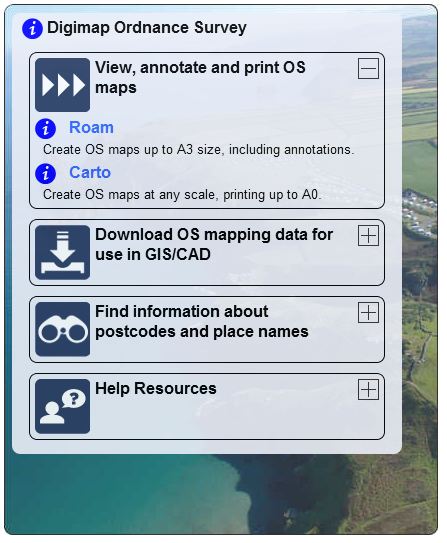
You may have noticed some changes to the Digimap interface over the past month. Yes, Digimap has a brand new and shiny new home page. The old home page had been around for a number of years and was starting to look it’s age. In this post we will take a look at the new interface to help you find your way around.
New Digimap Homepage
The new design splits the home page into 3 sections:
Maps and Data Collections panel – This panel provides top-level navigation allowing users to switch between different collections and account administration without having to leave the Digimap home page. When you select an option from this list, the information is displayed in the central panel.
Eagle-eyed users may have spotted that the left hand Maps and Data Collection panel has some room for expansion. We hope to add more data in the future and have been pulling together a number of environmental datasets which could form an Environment Collection. Do you have any suggestions for other collections you would like to see in Digimap? If you do, then add them as a comment.
Central Panel – the central panel provides links and information related to the collection selected from the left panel. The information is split into sections which can be expanded or hidden by clicking on the section headings. If you want to make a simple map, click the “view annotate and print” section to see what is available. Services, such as Roam and Data Download are accessed by clicking on the service names. If you want help or further information about a collection, look under the “Help Resources” section.
Digimap Ordnance Survey Panel
News panel – On the right hand side of the home page you will find links to the Digimap blog and twitter account. We intend to post interesting Digimap news here as well so it is well worth having a quick glance at this panel as you pass through the home page.
One really good aspect of the new home page is that it allows users to see collections their institution do not currently subscribe to. Why is this good? Well, if a collection looks interesting and of use in teaching and learning you may be able to show colleagues who may then be able to convince institutions to subscribe. Think of it as a shop window!
However, it has not all been plain sailing. The cosmetic changes are just the tip of the iceberg. Significant work has taken place on the connections, authentication and the databases. This work was tricky and threw up some unforeseen issues. If you spot something that isn’t working or just looks wrong, please contact us (edina@ed.ac.uk). It helps if you can tell us which web browser you are using too (and which version!). We would also like to hear what you think of the new interface; just add a comment to this post or send comments to the help desk (edina@ed.ac.uk).
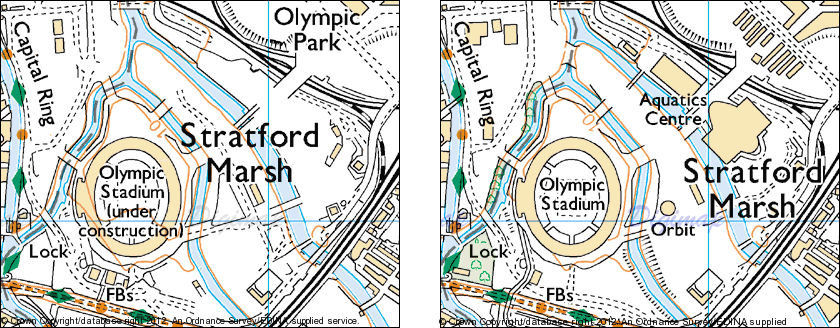
The 1:25,000 scale Raster mapping has been updated in Digimap Roam, Carto and Data Download. This new data is the latest release by Ordnance Survey from May 2012. There has been quite a few changes with just under a third of the country seeing updates with this release.
Some of the areas with the most changes have been in the Scottish Highlands and the main London 2012 Olympic site in East London.
It is great to see (what looks like) the mapping completed for the site, and to compare how it has taken shape over the last year. Download the maps from Data Download to view the changes for yourself.
Spot the difference between the Olympic site maps - 2011 (left) and 2012 (right)
On Tuesday 10th July we launched the new Digimap homepage. This makes it easier and quicker to find the services and resources you are looking for. The new interface allows you to browse the services available before logging in and you can even access all the training, help and support resources. There is a dynamic feed from the blog, a showcase of other services we offer, and links to our social media sites.
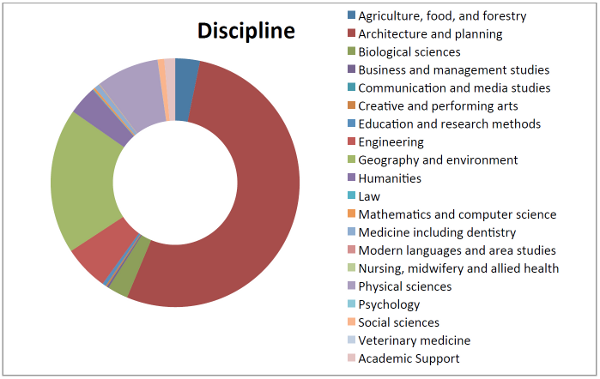
Digimap Ordnance Survey Collection Disciplines from the 2012 survey
These reports give an idea of who is using the services, what they are using them for and what their experience of using the site was like. There are a lot of interesting uses of the service quoted in the reports; it was very hard to pick the ones to include from the huge response that we had.
A final thank you to all those who filled in a survey.
Here are direct links to the reports about each geoservice provided by EDINA:
You may have noticed that there are currently surveys running on all the Digimap services. These surveys are there to give you the opportunity to help us improve the service; we want your views to help shape the future of Digimap.
There is also another reason we are asking these questions; in the current economic climate, JISC will be shortly undertaking a detailed review of all the geo-services they fund including Digimap. It is very important that you have your say about any of these services that you use as your responses will contribute to this process.
We thank all of you who have responded to this survey; last year the results were fed back into the service and many of the comments were very valuable in helping us decide future directions. It is due to your feedback last time that we have included new features such as the Annotation Tools and prioritised redevelopment of the Data Download interface. Our aim is to do the same again this time and we have given more space to finding out what you want us to do next in the questions.
For those of you that are finding the survey an inconvenience we do apologise, however we hope you understand our reasons for making it as noticeable as possible. Due to good response rates for the Ordnance Survey Collection and Historic Digimap we now allow users to ignore the survey straight away. There is still a short time delay on the Marine and Geology services to make sure people take the time to read what we are asking them to do.

 EDINA’s Geoforum 2013 was a great success with over 50 academic and support staff attending four very well received presentations: