Any views expressed within media held on this service are those of the contributors, should not be taken as approved or endorsed by the University, and do not necessarily reflect the views of the University in respect of any particular issue.
Digimap is an online map and data delivery service, available by subscription to UK Higher and Further Education establishments. Operated by EDINA at the University of Edinburgh, Digimap offers a number of data collections, including Ordnance Survey, historical, geological, aerial photography, LiDAR, marine maps, land cover mapping, global mapping and census data. For more information about Digimap go to our website: https://digimap.edina.ac.uk Background image Contains OS data (c) Crown Copyright and database right 2022
Until now anyone wanting to use OS MasterMap® Topography data in CAD software would have to convert their data, often a lengthy and complicated process. Now you can simply download the OS MasterMap Topography Layer in DWG format directly from Data Download. The DWG data should open in most CAD software such as AutoCAD, Vectorworks and ArchiCAD.
We always knew it wasn’t that easy to convert OS MasterMap data for use in CAD, the conversion software has a lot of options and can confuse at the best of times. The conversion software also doesn’t work on Apple Mac computers which are a popular choice with CAD users. However, we redoubled our efforts to provide DWG format data when we heard that some of our users were making PDF maps of OS MasterMap data and then manually digitising them from the screen… something had to be done!
Incorporating a conversion process into Data Download has not been simple and can produce some very large file sizes, especially if you need data for a busy urban area. Please only take enough OS MasterMap as necessary, or your computer may run out of memory when you work with the data.
Selecting DWG format
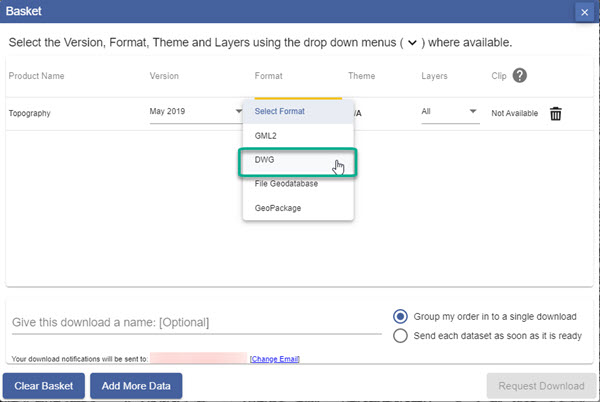
To get your data in DWG format simply follow the usual steps for making an order in Data Download:
Once you have added your OS MasterMap Topography data to the basket, use the drop down arrow in the Format column.
Select DWG format from the available formats.
Selecting a theme and layers
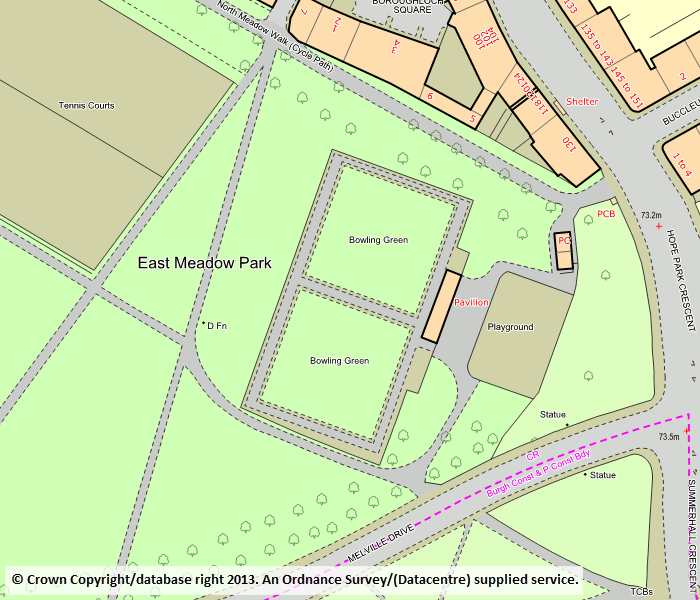
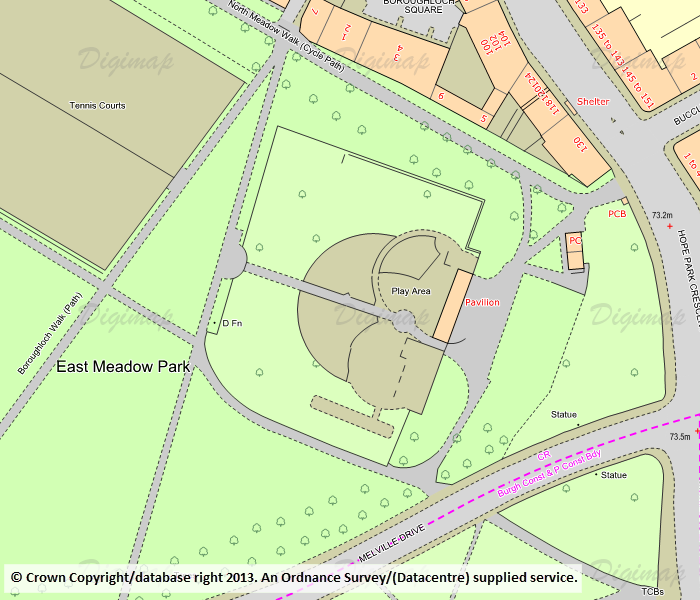
You can select one of two themes for your OS MasterMap topography data. Standard has full colour whereas Plan is in black and white with buildings outlined in red.
Note that you can also choose which layers of Os MasterMap data you wish to download – just select the Layers arrow and check the boxes next to the layers you need, e.g. Buildings, Rail, Roads etc.
Your OS MasterMap data will not need any conversion to open in most CAD software, enjoy playing with the vectors! Please let us know if you have any problems using this data or if you have suggestions as to how it could be improved.
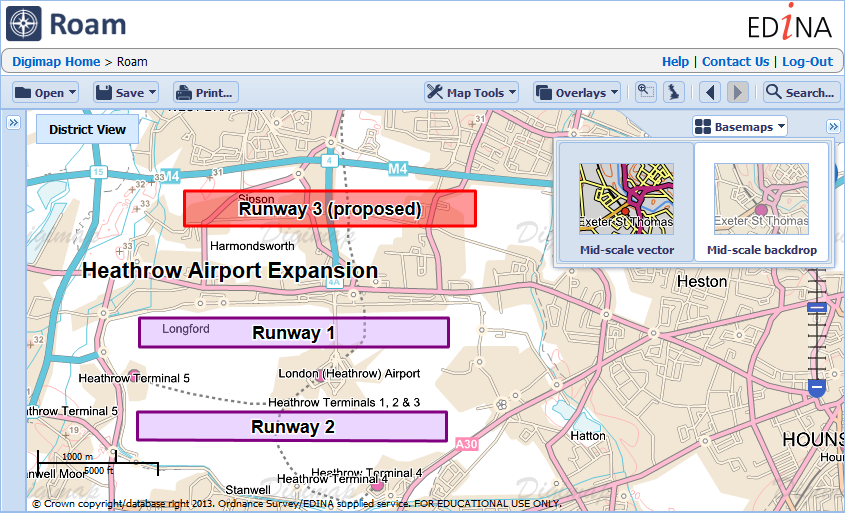
We have updated three of the mapping datasets in Digimap Roam, so you can now view mapping published as recently as June 2013.
The products updated are:
OS MasterMap: used in the three most detailed zoom levels in Roam.
OS VectorMap Local (VML): the next most detailed maps in Roam, available as alternate “Basemaps” in the 4th and 5th most detailed zoom levels.
Midscale Maps: These maps are made of the Meridian 2 mapping data along with contours. Until now they had been made with Land-form PANORAMA data, but now they use the new OS Terrain 50 contours:
These midscale maps are also available in a backdrop colour scheme which can be accessed by using the Basemaps tab at the top right of the map. The faded colours allow your annotations to show more strongly:
The updated datasets are also available from Digimap’s Data Download service (except MasterMap which will follow in the next few months), a page in Digimap Help details the all the OS products available and their currency in Roam and Data Download:
As part of ongoing efforts to improve the usability of data delivered by Digimap, we have made some significant enhancements to one of the Ordnance Survey licensed datasets.
OS VectorMap® Local is a relatively new product from Ordnance Survey providing slightly less detail than OS MasterMap but still very useful for detailed backdrop mapping. Individual buildings are shown as well as roads, rivers, landcover and contours. The vector version of the data is provided by Ordnance Survey in GML 2.1.2. This is a standard geospatial data format developed by the Open Geospatial Consortium; however it generally needs to be converted into a proprietary format before being used in GIS and CAD software.
To make using this data easier we are now providing OS VectorMap Local in both Shapefile and DWG formats. Shapefiles can be easily opened in ArcGIS and most other GIS programs including OpenSource GIS software such as QGIS and gvSIG. DWG is the native format for AutoCAD and can be used in many other CAD systems as well.
This data is now available for download from the Data Download application in the Digimap Ordnance Survey Collection. VectorMap Local is in the Vector Data section; to change the format of the data you are downloading click on the Change link under Options once you have added it to the basket.
Click image to view full size.
Creating the data:
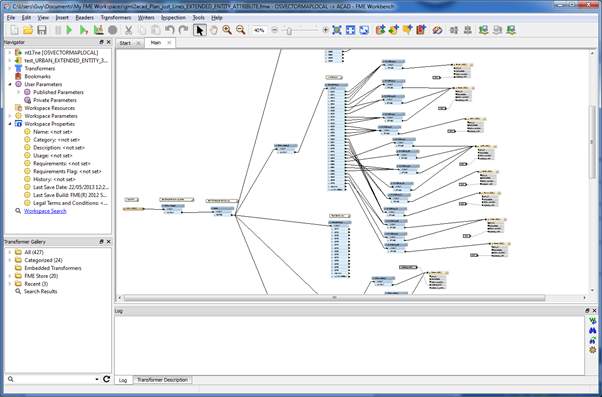
TO achieve the best results when recreating the data in different formats we had to use different software products for different formats. To convert the data to Shapefile we used the OpenSource Software GDAL program called “ogr2ogr” and for the DWG conversion we used FME from Safe Software. The image below shows part of the FME Workbench project used to convert the data to DWG.
Click image to view full size.
1: Shapefiles
To convert the GML to Shapefile we created a lookup table between the Feature Codes in the GML data to Shapefile Layers. As Ordnance Survey do not provide any guidance in their User Guide as to how to group features in VML , we analysed the data and experimented with various groupings, so that in the end we split the data into a possible 22 separate Layers. These layers may contain multiple feature classes but as they all have the original feature codes on them as attributes as well as all the other original attribution, further distinction between features can be achieved for representation and querying.
Example of the Shapefile data in ArcMap:
Click image to view full size.
A simple set of Layer Files has been created for use in ArcMap and can be downloaded from the VML Help page.
2. DWG
To convert the data to DWG we had to go through a similar process (as well as our data team becoming much more familiar with AutoCAD). We originally intended to produce DXF format data but this turned out to be a problem. We had to make some decisions about how to store attribution in the output data and one of the main considerations was the size of the resultant files. To begin with when we converted a tile of VML that was 60Mb of GML, it expanded in size to 240Mb when converted to DXF containing attributes as Inserts. This was unusable in systems we tried so we had to work on ways of making the files smaller. The first thing we did was change the format from DXF to DWG. As both formats are commonly read by various CAD systems this seems a reasonable thing to do although it may make the data slightly less interoperable. This changed the file size to 44Mb for our sample dataset. This was still quite large and some systems were having problems with this, especially when dealing with tiles in dense urban areas. We therefore decided to change the way we were storing attributes in the data. Instead of using Inserts we used Extended Entity Data (or XData) which was one of the options available in FME. This stores a fixed amount of information against an entity in the drawing. We use this to store the attribute information that was in the original GML data, including the original feature code. It’s a bit more difficult to work with this data but it can be viewed in AutoCAD Map 3D by using the Express Tools –> Tools –> List Object Xdata or typing xdlist in the command prompt.
Using XData brought the size of our sample tile down to 10Mb and was usable in all the systems we tested it with. If you need access to the attributes either as Inserts or as Map 3D Object data please let us know.
As part of the conversion process we defined the representation for features in the DWG file, including point symbols and area fills. Features have also been grouped together into separate Layers as we did with the Shapefiles.
Example of the data in AutoCAD:
Click image to view full size.
Finally, after getting the project set up in FME and a thorough testing of the data, we ran the batch process to convert the data. This took nearly 3 days per format to convert the full load of our national coverage of VML data. This data will be updated on the normal update schedule, as we get updated VML from Ordnance Survey as Change Only Updates so future conversions will be much quicker.
Remember,both these datasets are available through Data Download by selecting VectorMap Local and then changing the format after you have added the data to your basket.
We intend to produce alternative formats for other products, including OS MasterMap, so we would very much like to hear your thoughts on the data that we have produced so far and let us know if this meets your needs.
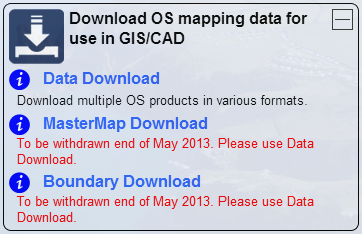
The functionality and datasets offered by MasterMap Download and Boundary Download are now available through the standard Data Download application. This can be found in the Download OS mapping data section of Digimap’s Ordnance Survey Collection.
This means that both MasterMap Download and Boundary Download will be withdrawn at the end of May 2013.
If you have teaching materials or course notes which are currently based on the old MasterMap Download and Boundary Download applications, please make sure you update them before these facilities are withdrawn.
If you have any concerns about this or any other issue then please contact us:
In January 2013 the OS MasterMap®, Boundary-Line™ and Code-Point® data products will be available from the Data Download service. We have tried to keep the changes necessary to accommodate these products to a minimum as the current interface has proved so successful (190,000 map tiles and files downloaded Nov 2012).
Here is a list of the changes and additions you will see in the interface; please note that they may still be subject to some change prior to launch.
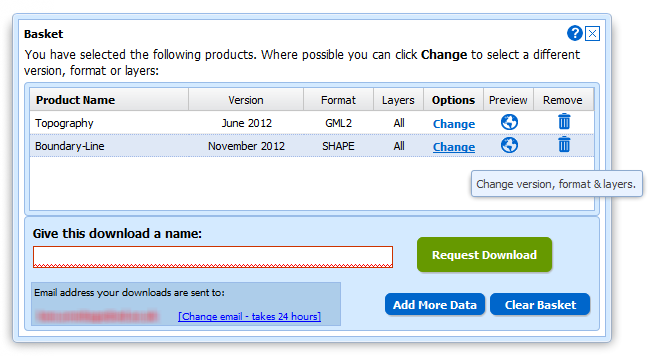
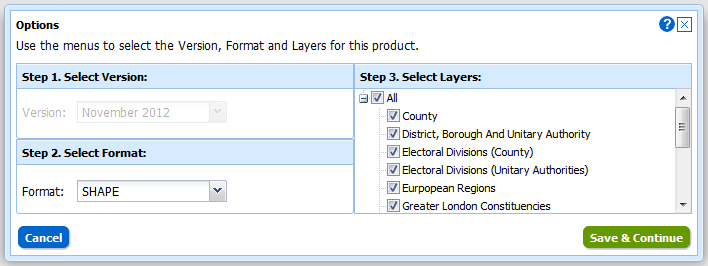
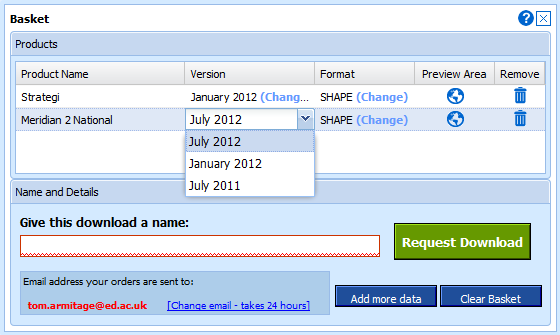
Both Boundary-Line and MasterMap have layers so we have had to make changes to the basket:
Instead of selecting Version and Format using drop-down menus there is a new pop-up for changing both these and the layers for each of the products in your basket. You can access this pop-up by clicking on the Change link in the Options column:
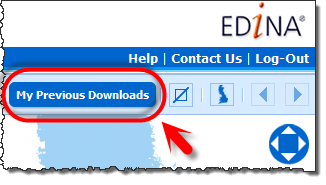
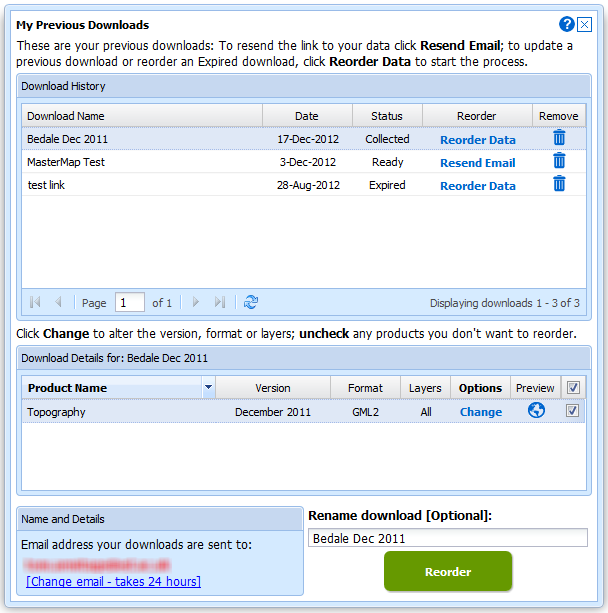
We have also improved the “My Account” section which is now called “My Previous Downloads”:
Once in the interface you can access any of your past downloads and reopen them at the basket stage:
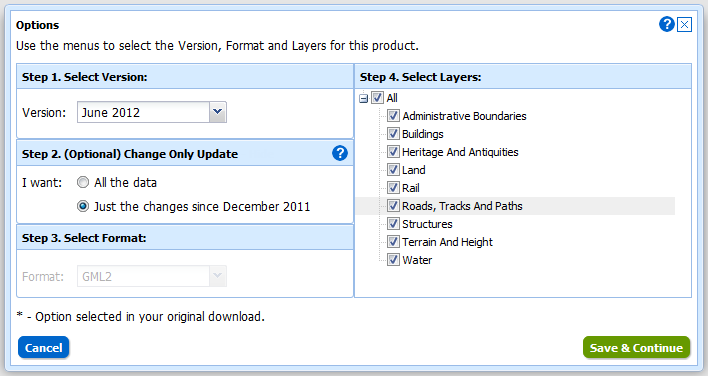
It is now much easier to update your previous downloads to the latest version, get the same data in a different format or simply reorder data you have previously taken. In addition to these functions we have incorporated the ability to make Change-Only-Updates (COUs) to MasterMap Data:
Both Boundary Download and MasterMap Download will be kept in service for a transition period but as there are so many benefits to using Data Download we hope everyone will make the switch quickly. We expect to have switched off these services by the end of April.
When Digimap was first launched in 2000 we consulted our users to find out how often they wanted the service updated. We found that at the time, the majority of our users wanted consistent maps and data throughout the academic year. Therefore it became Digimap policy to only update the information during the summer break so that new mapping became available for the next academic year.
As the new Data Download allows access to previous datasets during each academic year there will always be a dataset that remains constant throughout the year for those who require it. Therefore we have decided to update the maps as soon as possible after we receive the new data.
We still get most of our data updates in late spring/early summer so it is likely that you may not notice any difference to when the updates arrive, however the default setting will be to offer the most up-to-date data we have. If an update has come in since the start of the academic year you will need to change the version from the default to get the previous data.
We will use the blog notify you of any maps and data changes we make; you can see the dates of all the Ordnance Survey data we have available here:
The new Data Download has been updated with a few more enhancements that will make it even easier to use; it is now no longer in BETA.
A selection of the improvements made include:
Changes to where you change between panning the map and drawing a rectangle to select to make it more obvious what you are doing.
A general improvement of the lay out and buttons used.
My Account has been moved to the top right of the screen.
Better product information by clicking on the icon.
You can clear the selection you have just made using the button.
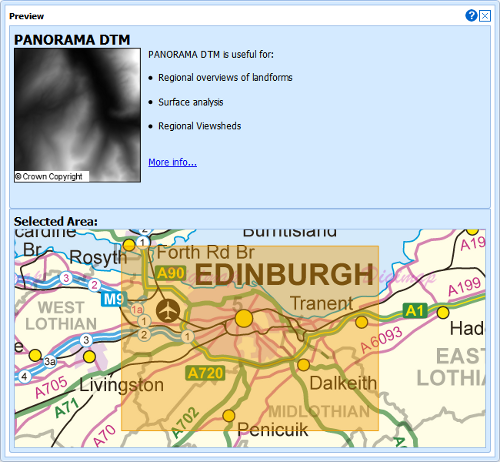
A greatly improved preview of the each dataset in basket, showing what the product is like, what it can be used for, and the extent of the area you are taking:
These changes have been made in response to recommendations from a usability project run in conjunction with the redevelopment of the Data Download service. You can read more about this project, called USeD, on its blog here:
The enhancements also include a fix to a bug that some users experienced when using the latest version of the Google Chrome web browser; the interface no longer offsets the area you select when displaying it on the map.
The VectorMap Local (VML) data in the New Data Download service has been updated, it is now current as of April 2012.VML data is currently only available to download in GML format as supplied by Ordnance Survey. However you can download a free converter from Rolta which will convert the GML to Shapefiles or MapInfo TAB files. There is guidance on where to get the converter and some pointer on how to use it on the following help page:
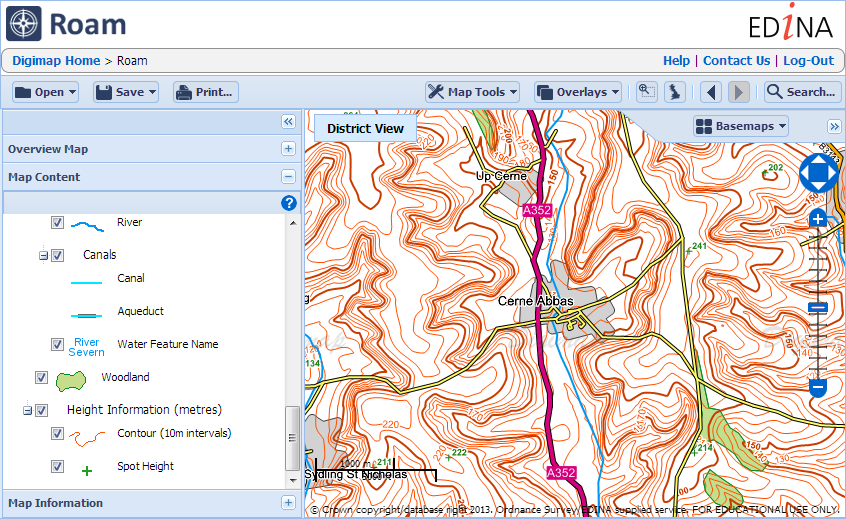
Processing the data for Digimap Roam takes a little longer than making it available for Download, but we hope to have it into service in the not too distant future. Remember that if you want to see VML data in Roam you have to zoom in to the Street View and use the alternative representations to change from the 1:10 000 Raster data to one of the four different VML styles.
Full instructions on how to view VML data in Digimap Roam can be found in this video:
Due the success of the New Data Download we are announcing the retirement of our old Data Download and Gazetteer Download facilities. The new Data Download performs all the functions of the two older ones, which have now been around for many years.
Were not stopping there though as the new Data Download is continuing to be developed and we hope to have a few enhancements added in June. In addition to this the data from Boundary Download will be brought in later this year and eventually MasterMap data will be included. This will allow you to get all the Ordnance Survey Data offered by Digimap from one single facility.
Please note that the Gazetteer Query and Gazetteer Plus services will not be affected.
If you have any comments or suggestions about the new Data Download facility or any other part of the Digimap service then please let us know: edina@ed.ac.uk
On the 13th of September we held the annual update of the maps and map data in Digimap. There haven’t been any major specification changes this time though you will notice some cartographic changes to the MiniScale maps in Digimap Roam.
The Urban areas are now purple and on the more zoomed out maps there has been some enhancement to the relief shading.
All the following data products were updated to the latest version available:
MasterMap Topography and ITN Layers:
Meridian2
Strategi
MiniScale
Code-Point
Code-Point with Polygons
Boundary Line
1:250,000 Colour Raster
1:50 000 Colour Raster
1:25 000 Colour Raster
1:10 000 Raster
1:50 000 Scale Gazetteer
All the products have been updated in Digimap Roam, Carto and all the different Data Downloaders. The following products were not updated as the versions were already the most up-to-date available:

 Until now anyone wanting to use OS MasterMap® Topography data in CAD software would have to convert their data, often a lengthy and complicated process. Now you can simply download the OS MasterMap Topography Layer in DWG format directly from Data Download. The DWG data should open in most CAD software such as AutoCAD, Vectorworks and ArchiCAD.